
Jun Ye, Xiaoya Ma, Yang Zhang, Jiangming Xu, Hanwei Zhang, Tianfu Yao, Jinyong Leng, Pu Zhou. Revealing the dynamics of intensity fluctuation transfer in a random Raman fiber laser[J]. Photonics Research, 2022, 10(3): 618
- Photonics Research
- Vol. 10, Issue 3, 618 (2022)
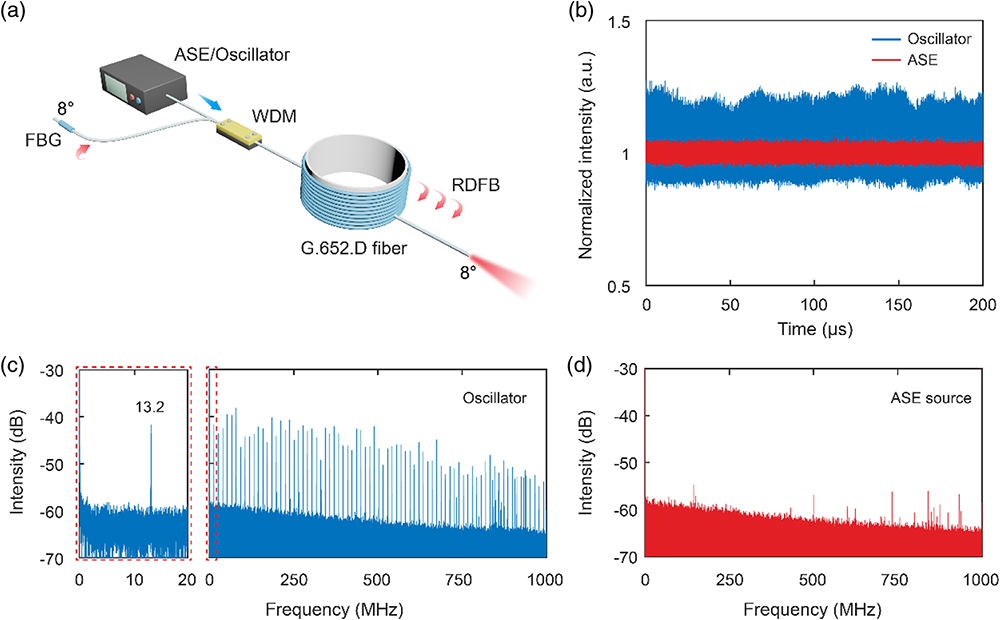
Fig. 1. (a) Schematic of the experimental setup. ASE, amplified spontaneous emission; WDM, wavelength division multiplexer; FBG, fiber Bragg grating; RDFB, random distributed feedback. (b) Normalized temporal profiles of the fiber oscillator and the ASE source. Radio frequency (RF) spectra of (c) the fiber oscillator and (d) the ASE source. Inset of (c) shows a zoom-in around the fundamental repetition rate of the fiber oscillator.
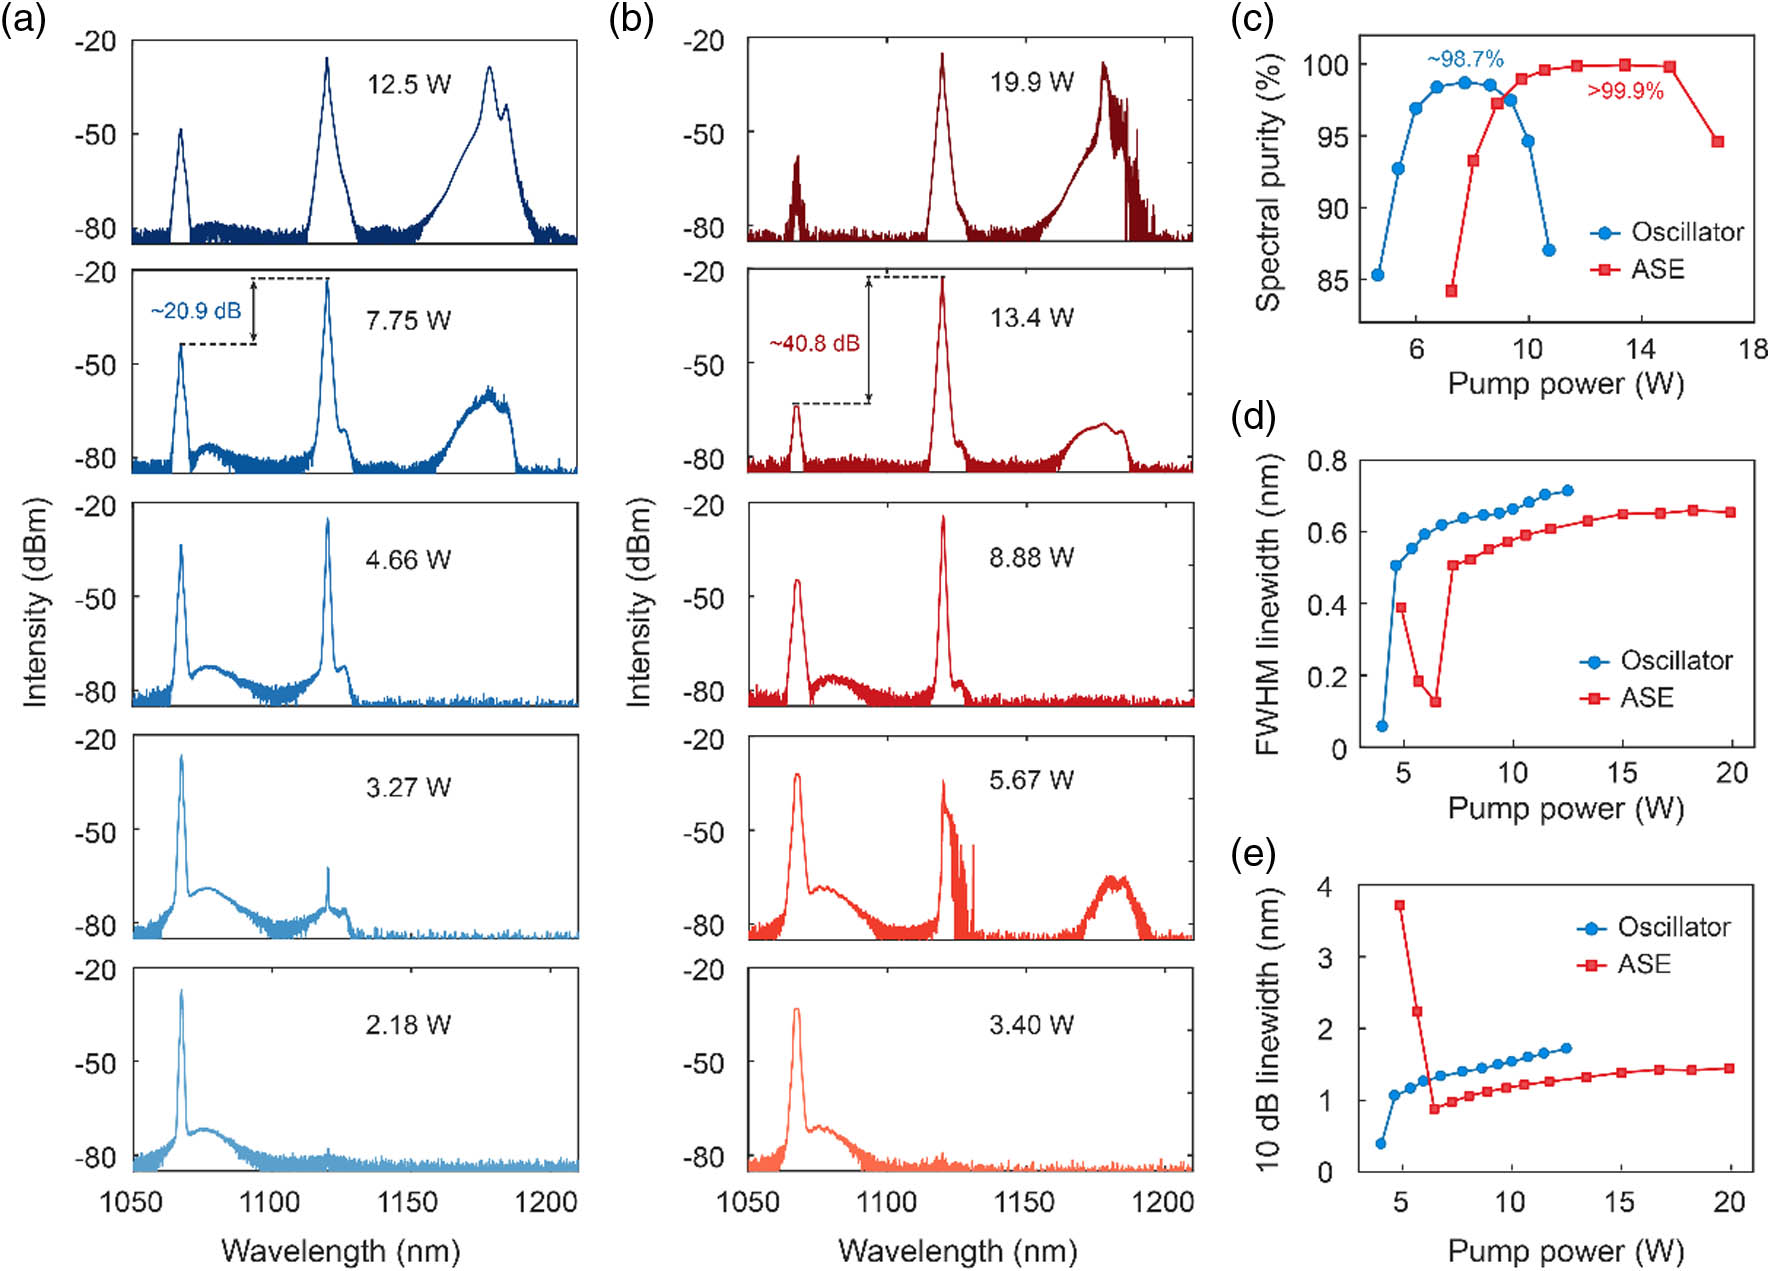
Fig. 2. Spectral evolution of the RRFL pumped by (a) the fiber oscillator and (b) the ASE source. Legends indicate the injected pump powers. (c) Spectral purity, (d) FWHM linewidth, and (e) 10-dB linewidth of the 1st-order Stokes wave as functions of pump power.
Fig. 3. (a) Output powers of the 1st-order Stokes wave (circles) and the 2nd-order Stokes wave (squares). (b) Temporal profiles and (c) corresponding RF spectra of the 1st-order Stokes wave at the maximum output powers. Blue lines (points) and red lines (points), respectively, indicate the results pumped by the fiber oscillator and ASE source.
Fig. 4. Snapshot of longitudinal power distributions with the pump fluctuation amplitude of (a) 2 W and (b) 5 W. (c) Normalized fluctuation amplitude (NFA) of the 1st-order Stokes wave as a function of the pump NFA. (d) Spectral purity dependence on the pump NFA. Note that the pump fluctuation frequency for (a)–(d) is fixed at 10 MHz. Output temporal behaviors with different pump fluctuation frequencies of (e) 10 MHz, (f) 100 MHz, and (g) 1 GHz. (h) RIN transfer with and without temporal walk-off effect. The total pump power is 10 W, and the fiber length is 2 km. RIN transfer dependence on (i) walk-off parameter and (f) fiber length.
Fig. 5. Comparison of the output characteristics with the pumping of fiber oscillator and ASE source. (a) Simulated power evolutions and (b) longitudinal power distributions. (c) Simulated and (d) experimental output spectrum of the 1st-order Stokes wave. The central wavelength is 1120 nm. (e) Simulated temporal profiles of the 1st-order Stokes wave. The pump power for (b)–(e) is fixed at 8 W.
|
Table 1. Parameter Values in the Simulation (Part I)
|
Table 2. Parameter Values in the Simulation (Part II)

Set citation alerts for the article
Please enter your email address
© Copyright 2018-2021 | Chinese Laser Press. All Rights Reserved 沪ICP备15018463号-20