
Dongxia Hu, Yudong Tao, Jingui Ma, Jing Wang, Heyuan Zhu, Liejia Qian, "Analysis and evaluation of idler absorption for quasi-parametric chirped-pulse amplification," Chin. Opt. Lett. 16, 121901 (2018)
- Chinese Optics Letters
- Vol. 16, Issue 12, 121901 (2018)
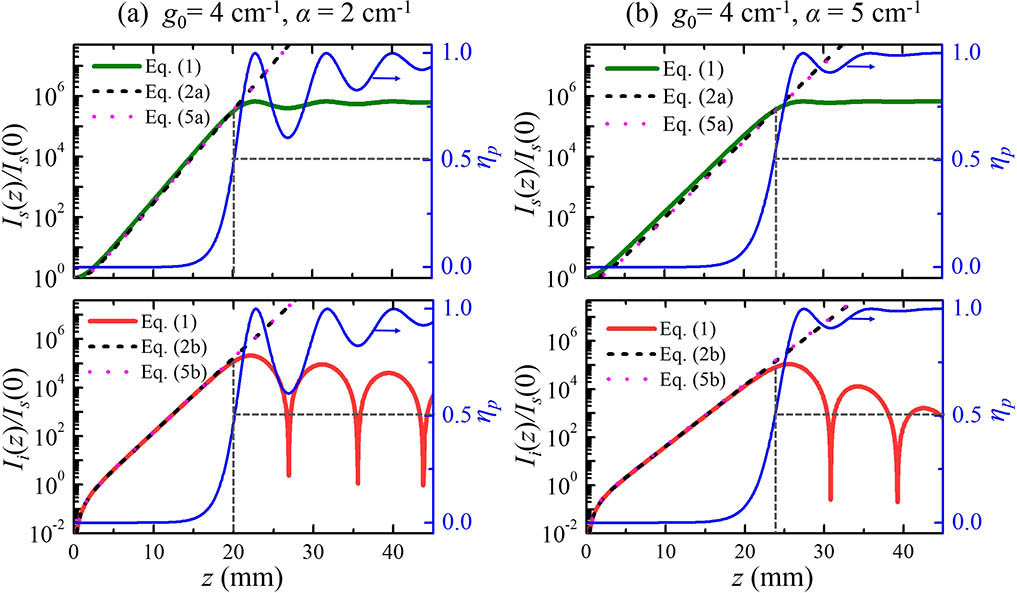
Fig. 1. Numerical solutions of signal gain I s ( z ) / I s ( 0 ) I i ( z ) / I s ( 0 ) η p z α = 2 cm − 1 α = 5 cm − 1 2 ) and (5 ) are plotted as dashed and dotted lines, respectively, for comparison.
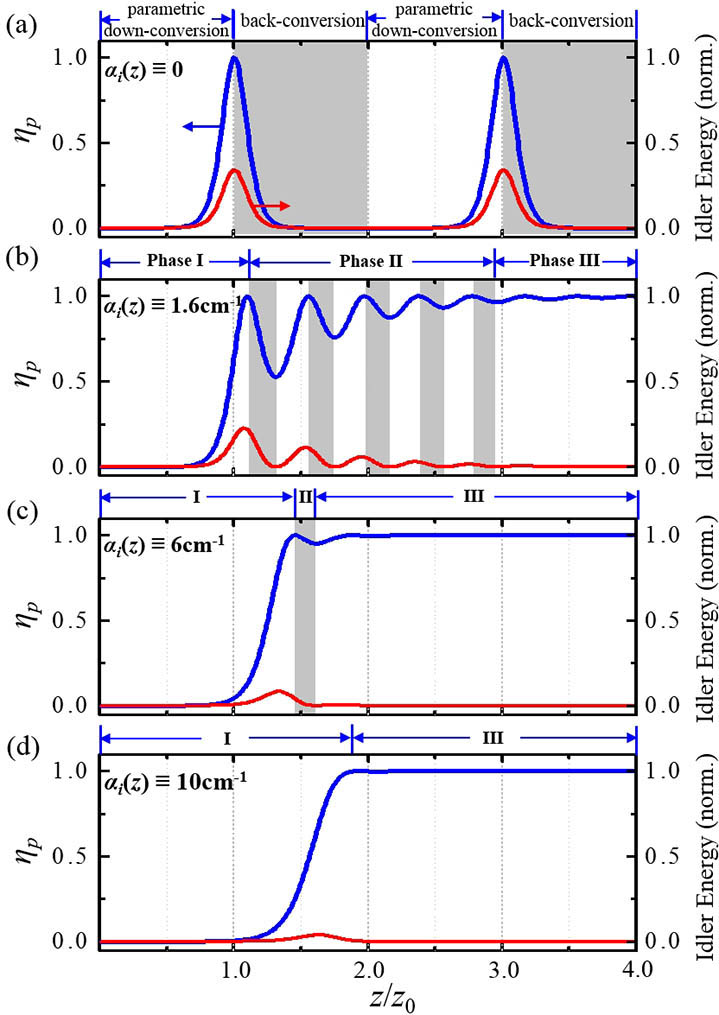
Fig. 2. Pump depletion curves (blue lines) for (a) OPCPA with α = 0 α = 1.6 cm − 1 α = 6 cm − 1 α = 10 cm − 1
Fig. 3. (a), (b), (c) Contour maps of pump depletion η p z / z 0 α / g 0 η p ∼ 0.08 I p I s ( 0 ) / I p ( 0 ) Δ k 7 ), respectively.
Fig. 4. Pump depletion contour map versus the crystal length z I p α i ( z ) = 5.3 cm − 1 α i ( z ) = 0
Fig. 5. (a) Contour map of the pump depletion ratio versus the crystal length z α / g 0 1 . (b) Two different idler-absorption spectra and (c) their corresponding efficiency curves. The pump is assumed to be spatiotemporally top-hat in (b) and (c).
Fig. 6. Comparison of (a) idler-absorption coefficient, (b) signal gain, (c) pump depletion, and (d) idler intensity in OPCPA (solid lines) and QPCPAs with a constant absorption (dash dot lines), a step absorption function (dashed lines), and an exponential gradient absorption function (dotted lines), respectively.
|
Table 1. Default Simulation Parameters in This Letter


Set citation alerts for the article
Please enter your email address

© Copyright 2018-2021 | Chinese Laser Press. All Rights Reserved 沪ICP备15018463号-20