
Ahui Hou, Yihua Hu, Nanxiang Zhao, Jiajie Fang, Shilong Xu, Quan Zhou, "Full-waveform fast correction method for photon counting Lidar," Chin. Opt. Lett. 19, 052701 (2021)
- Chinese Optics Letters
- Vol. 19, Issue 5, 052701 (2021)
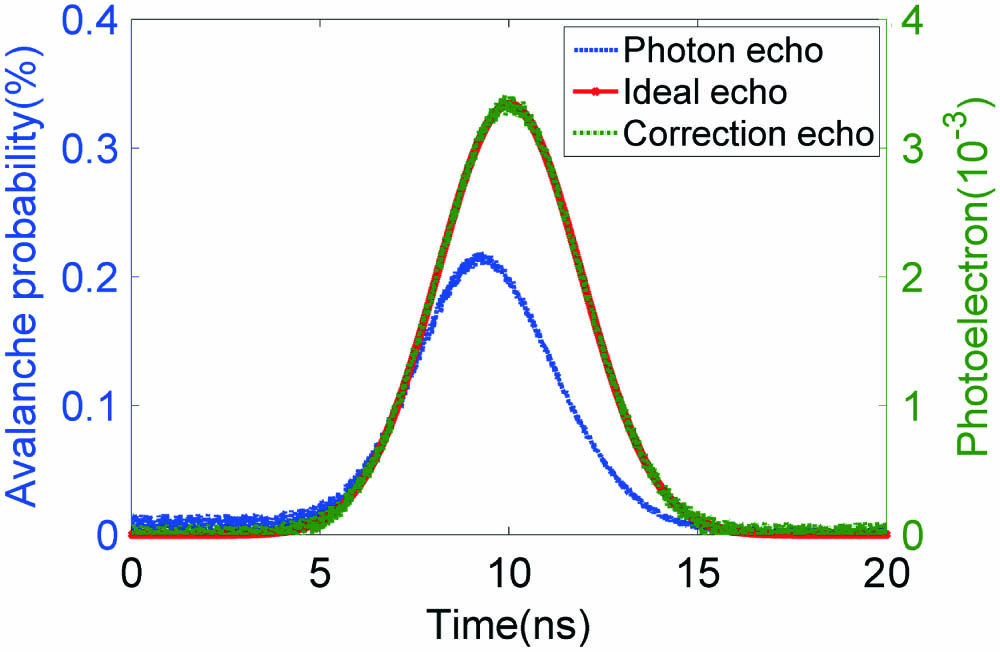
Fig. 1. Waveform distortion among the pulse laser, photon, and corrected waveforms.
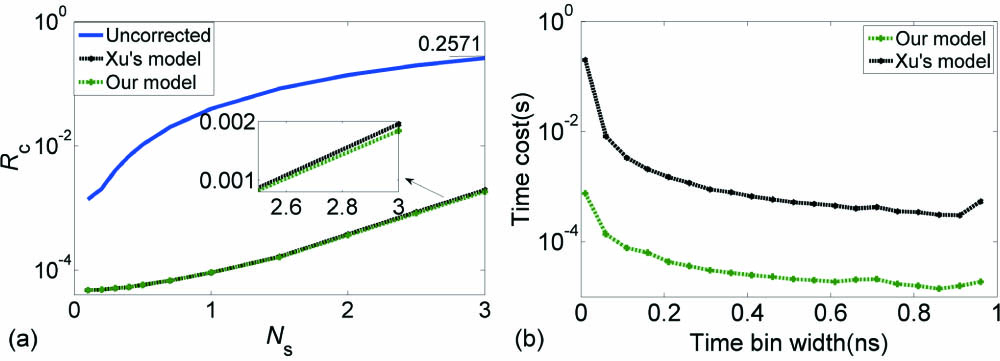
Fig. 2. Comparison with Xu et al.’s method. (a) Correlation distance versus the intensity; (b) time cost versus the width of the time bin.
Fig. 3. Description of the photon counting system. (a) Schematic diagram: the components are a semiconductor laser source, a GM-APD detector, a TCSPC system, and the optical system. The optical system contains a beam splitter (BS), PIN fast photodiode, optical attenuation system (OAS), beam expansion (BE), telescope, bandpass filter (BPF), and fiber coupling receiver (FCR); (b) photograph of the experiment system.
Fig. 4. Photon waveform, which is the statistical histogram from multiple cumulative detections of TCSPC and corrected waveform when (a) Ns
Fig. 5. Correlation distance versus the average number of photons.
Fig. 6. Photon waveforms and correction waveforms of depth targets with (a) Ns
Fig. 7. Photon waveforms and correction waveforms of depth targets with (a) Ns
|
Table 1. Comparison of Correction Effects with Different Echo Photon Numbers


Set citation alerts for the article
Please enter your email address

© Copyright 2018-2021 | Chinese Laser Press. All Rights Reserved 沪ICP备15018463号-20