• Acta Physica Sinica
  • Vol. 69, Issue 8, 080701-1 (2020)
Cong Wang1、2, Jie Yan2、3、*, Xu Wang4, and Min Li5
Author Affiliations
  • 1Department of Computer Science & Technology, Sichuan Police College, Luzhou 646000, China
  • 2Institute of Sichuan Police Science, Sichuan Police College, Chengdu 610200, China
  • 3Department of Road Traffic Management, Sichuan Police College, Luzhou 646000, China
  • 4School of Movie and Media, Sichuan Normal University, Chengdu 610068, China
  • 5School of Computer Science, Sichuan Normal University, Chengdu 610068, China
  • show less
    DOI: 10.7498/aps.69.20200285 Cite this Article
    Cong Wang, Jie Yan, Xu Wang, Min Li. Analysis on early spatiotemporal transmission characteristics of COVID-19[J]. Acta Physica Sinica, 2020, 69(8): 080701-1 Copy Citation Text show less
    Comparing the actual cumulative number of cases and its estimations according to different: (a) Year 2019; (b) year 2020.
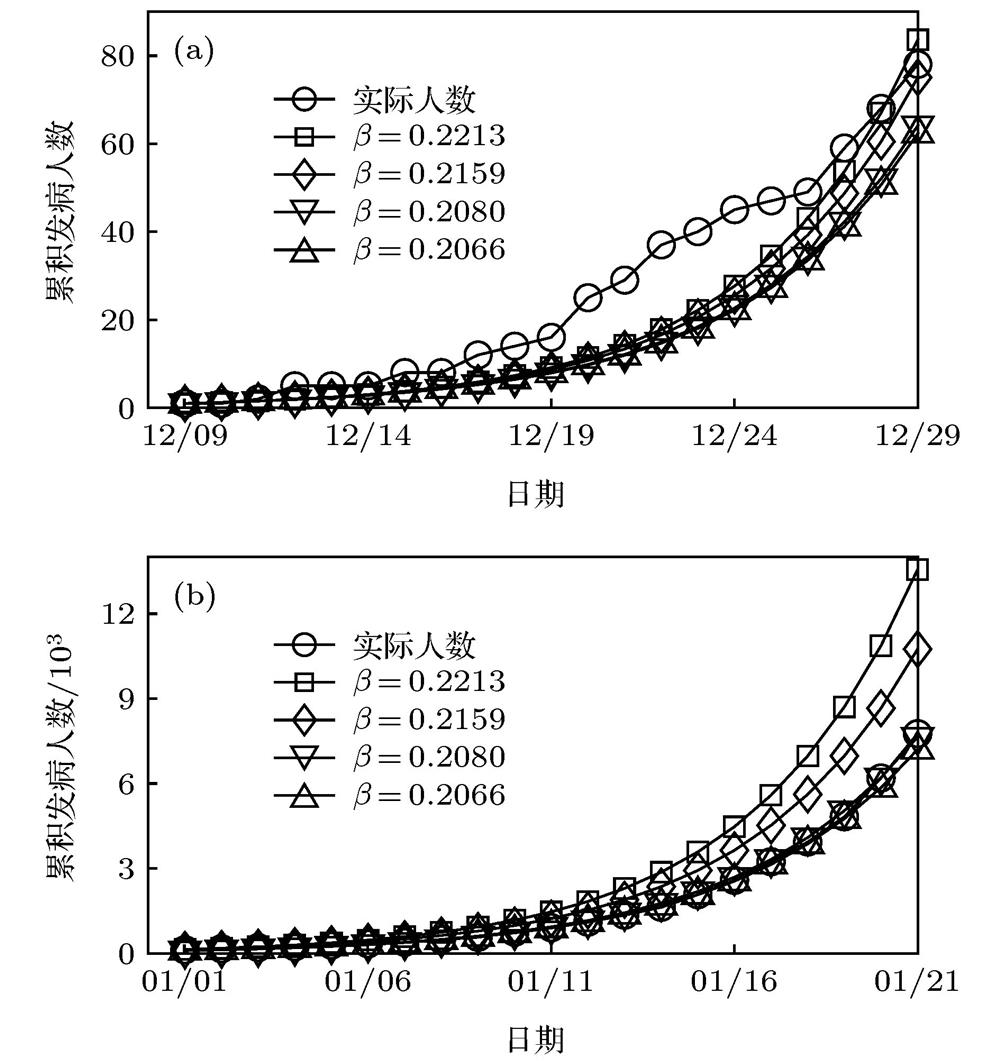
    Fig. 1. Comparing the actual cumulative number of cases and its estimations according to different : (a) Year 2019; (b) year 2020.
    Comparing the migration index of Wuhan before the spring festival with the same period of 2019: (a) Inner migration index; (b) outer migration index.
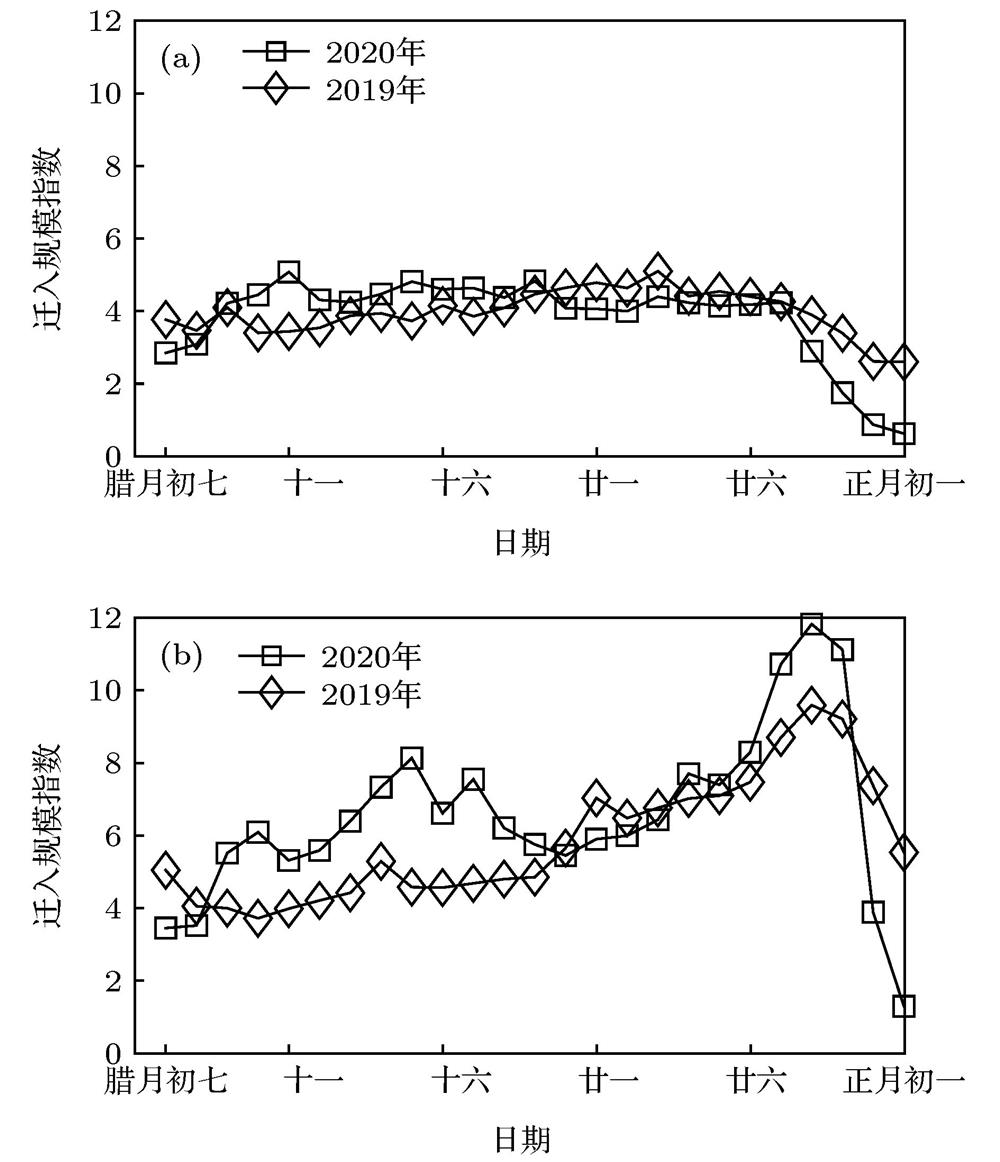
    Fig. 2. Comparing the migration index of Wuhan before the spring festival with the same period of 2019: (a) Inner migration index; (b) outer migration index.
    The estimation errors of the first arrival times for each provinces.
    Fig. 3. The estimation errors of the first arrival times for each provinces.
    日期人数日期人数日期人数日期人数日期人数
    12/09112/171212/212912/254712/2978
    12/11212/181412/223712/264912/3090
    12/12512/191612/234012/275912/31102
    12/15812/202512/244512/2868
    Table 1.

    The cumulative number of confirmed cases in 2019.

    2019年累积发病人数

    截至时点估计发病人数实际发病人数上报CCDC人数
    软件抓取法蒙特卡罗法
    2019/12/31102491020
    2020/01/10738459738—78141
    2020/01/20616258006143—6187291
    2020/01/31326612965432633—3267711821
    2020/02/1144692691634467244730
    Table 2.

    The cumulative number of confirmed cases in each time slots in 2020.

    2020年各时间段累积发病人数

    截止日期$\beta $置信区间R2截止日期$\beta $置信区间R2
    2019/12/310.2213[0.2152, 0.2274]0.8682020/01/110.2066[0.2056, 0.2274]0.990
    2020/01/010.2171[0.2116, 0.2225]0.8782020/01/120.2063[0.2056, 0.2071]0.993
    2020/01/020.2168[0.2127, 0.2209]0.92320200/1/130.2060[0.2054, 0.2067]0.995
    2020/01/030.2159[0.2127, 0.2191]0.9492020/01/140.2059[0.2054, 0.2064]0.997
    2020/01/040.2155[0.2130, 0.2179]0.9672020/01/150.2056[0.2052, 0.2060]0.998
    2020/01/050.2138[0.2118, 0.2159]0.9732020/10/160.2058[0.2054, 0.2061]0.998
    2020/01/060.2127[0.2109, 0.2144]0.9802020/01/170.2060[0.2057, 0.2063]0.999
    2020/01/070.2109[0.2093, 0.2126]0.9802020/01/180.2064[0.2061, 0.2066]0.999
    2020/01/080.2091[0.2075, 0.2107]0.9792020/01/190.2065[0.2063, 0.2067]0.999
    2020/01/090.2080[0.2067, 0.2094]0.9842020/01/200.2066[0.2064, 0.2068]0.999
    2020/01/100.2067[0.2054, 0.2080]0.9852020/01/210.2070[0.2068, 0.2073]0.999
    Table 3. Possible values of the infection rate.
    截至时点$\beta $
    0.22130.21590.20800.2066
    2019/12/311301169795
    2020/01/1011901001777753
    2020/01/2010870866662205964
    Table 4.

    Cumulative confirmed cases in key time nodes.

    重要时间节点的累积发病人数

    日期迁徙指数人数/万日期迁徙指数人数/万日期迁徙指数人数/万
    2020/01/106.6232272020/01/2211.840329.962019/01/297.028227.2
    2020/01/117.561229.82019/01/214.571821.62019/01/307.107227.7
    2020/01/126.2165272019/01/224.689221.42019/01/317.480028.1
    2020/01/135.762024.82019/01/234.8062232019/02/018.714029.8
    2020/01/155.908726.52019/01/244.860521.72019/02/029.604331.5
    2020/01/166.002827.72019/01/267.0436272019/02/039.224729.1
    2020/01/197.4060302019/01/286.770626.8
    Table 5.

    The Baidu inner migration index and the number of the travelers sent from Wuhan`s major railway stations.

    武汉市三大火车站发送旅客人数与迁出指数

    省份$\beta $实际日期省份$\beta $实际日期
    0.22130.21590.20700.22130.21590.2070
    安徽01/0601/0601/0701/07辽宁01/1101/1201/1301/09
    北京01/0701/0701/0801/08*内蒙古01/1301/1401/1601/16
    福建01/0901/0901/1001/06宁夏01/1701/1801/2001/17
    甘肃01/1001/1101/1201/04青海01/1901/2101/2301/21
    广东01/0501/0501/0601/04山东01/0801/0801/0901/08
    广西01/0801/0901/0901/13山西01/0901/1001/1001/14
    贵州01/0801/0801/0901/06陕西01/0901/0901/1001/12
    海南01/1001/1101/1201/13上海01/0801/0801/0901/10
    河北01/0801/0901/0901/13四川01/0801/0801/0901/07
    河南01/0401/0401/0501/03天津01/1401/1501/1601/11
    黑龙江01/1201/1301/1401/12西藏> 01/23> 01/23> 01/2301/30
    湖南01/0501/0501/0601/05新疆01/1201/1201/1401/17
    吉林01/1501/1501/1701/14云南01/0901/1101/1001/07
    江苏01/0601/0701/0701/10浙江01/0701/0701/0801/04
    江西01/0601/0701/0701/07重庆01/0801/0801/0901/06
    Table 6.

    The arrival times of each provinces.

    省级区域的首例到达时间

    Cong Wang, Jie Yan, Xu Wang, Min Li. Analysis on early spatiotemporal transmission characteristics of COVID-19[J]. Acta Physica Sinica, 2020, 69(8): 080701-1
    Download Citation