• Chinese Optics Letters
  • Vol. 14, Issue 4, 041301 (2016)
Daigao Chen1、2, Xi Xiao2、*, Lei Wang2, Wen Liu1、3、**, and Qi Yang2
Author Affiliations
  • 1Wuhan National Laboratory for Optoelectronics, Huazhong University of Science and Technology, Wuhan 430074, China
  • 2State Key Laboratory of Optical Communication Technologies and Networks, Wuhan Research Institute of Posts Telecommunications, Wuhan 430074, China
  • 3Department of Optics and Optical Engineering, University of Science and Technology of China, Hefei 230026, China
  • show less
    DOI: 10.3788/COL201614.041301 Cite this Article Set citation alerts
    Daigao Chen, Xi Xiao, Lei Wang, Wen Liu, Qi Yang. Polarization rotator-splitter covering full optical communication bands based on L-shaped cross-section waveguide[J]. Chinese Optics Letters, 2016, 14(4): 041301 Copy Citation Text show less
    (a) Schematic of the proposed PRS. Top: three-dimensional view, middle: overhead view, and bottom: cross- section view. The dotted lines encircling the region are the overlap of the two different waveguides. (b) The effective refractive indices of the first three modes of the L-waveguide as the function of the higher waveguide width (W2) and the lower waveguide width (W3). The calculation wavelength is 1550 nm. Mode 1, mode 2, and mode 3 are represented by the solid, dashed, and dotted lines, respectively.
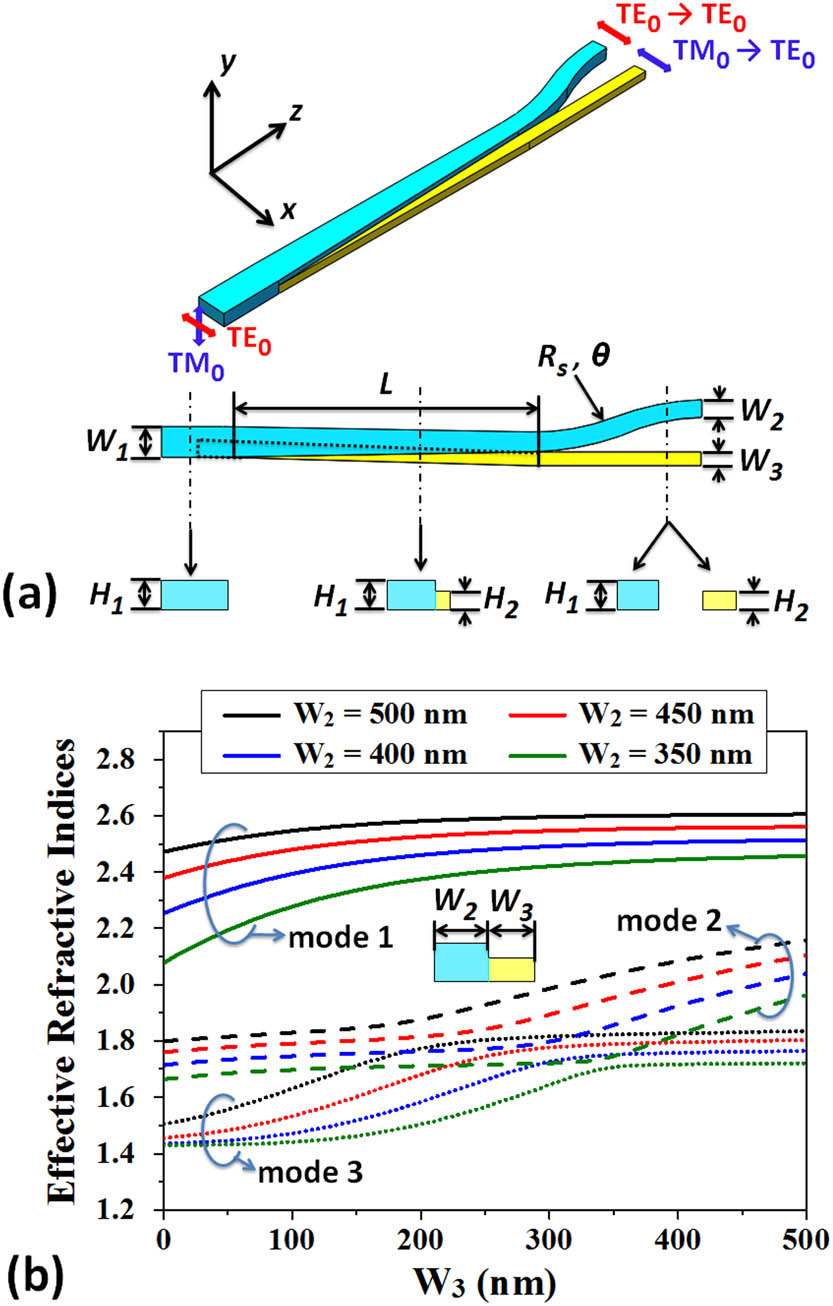
    Fig. 1. (a) Schematic of the proposed PRS. Top: three-dimensional view, middle: overhead view, and bottom: cross- section view. The dotted lines encircling the region are the overlap of the two different waveguides. (b) The effective refractive indices of the first three modes of the L-waveguide as the function of the higher waveguide width (W2) and the lower waveguide width (W3). The calculation wavelength is 1550 nm. Mode 1, mode 2, and mode 3 are represented by the solid, dashed, and dotted lines, respectively.
    (a) Mode indices and profiles evolution along the L-waveguide with W2=450 and W3=400 nm at the wavelength of 1550 nm. (b) Average transmission efficiency varied with the L-waveguide length over a wavelength range from 1500 to 1600 nm.
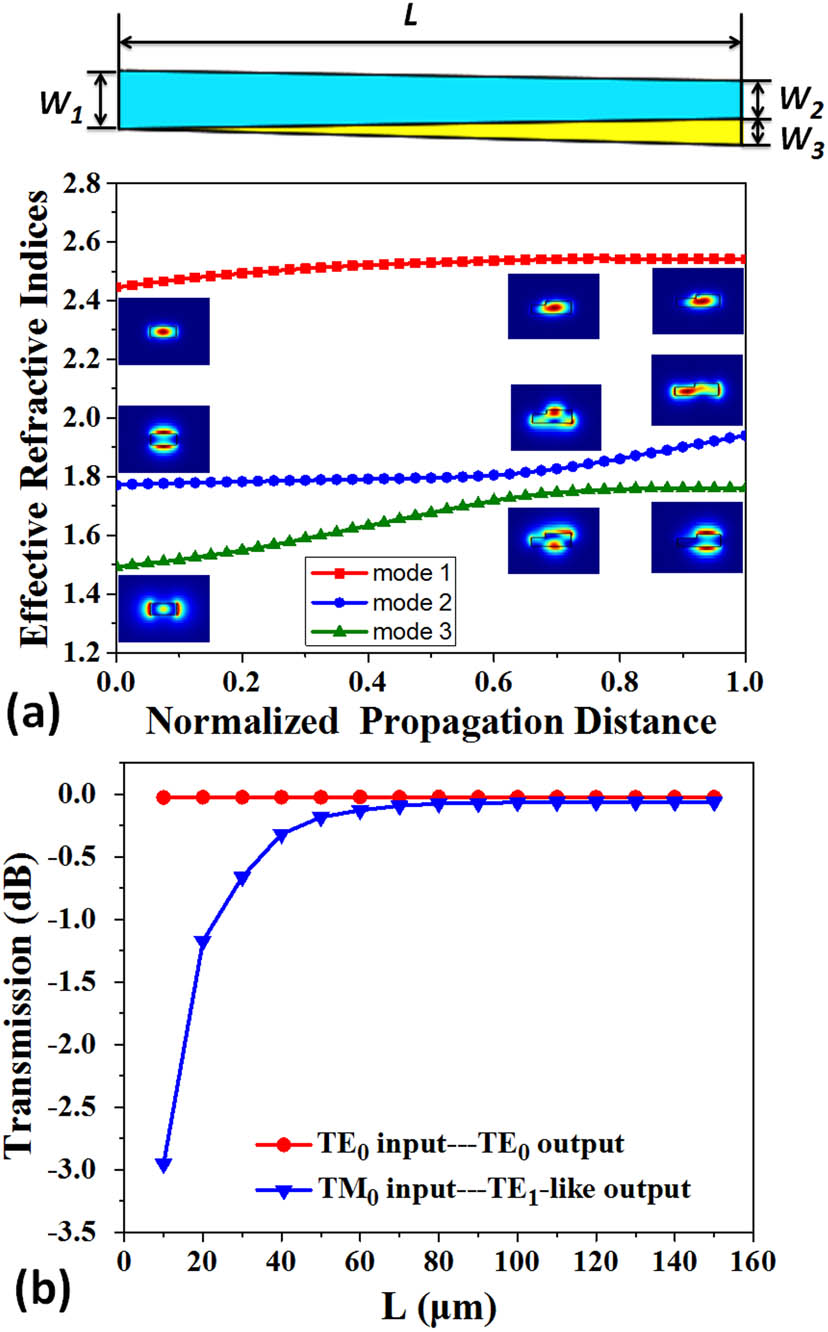
    Fig. 2. (a) Mode indices and profiles evolution along the L-waveguide with W2=450 and W3=400nm at the wavelength of 1550 nm. (b) Average transmission efficiency varied with the L-waveguide length over a wavelength range from 1500 to 1600 nm.
    Average transmission efficiency varied with the radius of the S-bend waveguide of the asymmetrical Y-junction over a wavelength range from 1500 to 1600 nm.
    Fig. 3. Average transmission efficiency varied with the radius of the S-bend waveguide of the asymmetrical Y-junction over a wavelength range from 1500 to 1600 nm.
    (a)–(d) Simulated field intensity distributions at 1310 and 1550 nm wavelengths. (e)–(f) Different modes’ outputs efficiencies as a function of the wavelength in the two output ports. Transmission efficiency below −40 dB is not shown.
    Fig. 4. (a)–(d) Simulated field intensity distributions at 1310 and 1550 nm wavelengths. (e)–(f) Different modes’ outputs efficiencies as a function of the wavelength in the two output ports. Transmission efficiency below 40dB is not shown.
    (a) Schematic of the proposed PRS. Top: before shortening, bottom: after shortening. (b)–(e) Simulated field intensity distributions of the shortened PRS at 1310 and 1550 nm wavelengths. (f)–(h) Different modes’ output efficiencies as a function of the wavelength in the two output ports of the shortened PRS. Transmission efficiencies below −40 dB are not shown.
    Fig. 5. (a) Schematic of the proposed PRS. Top: before shortening, bottom: after shortening. (b)–(e) Simulated field intensity distributions of the shortened PRS at 1310 and 1550 nm wavelengths. (f)–(h) Different modes’ output efficiencies as a function of the wavelength in the two output ports of the shortened PRS. Transmission efficiencies below 40dB are not shown.
    Simulated the transmission efficiencies varied with (a) the higher waveguide width deviation, (b) the lower waveguide width deviation, (c) the alignment error, and (d) the etching depth deviation. The transmission efficiencies of 1310 nm wavelength are the dashed line, and that of the 1550 nm wavelength are the solid line. The above figures are the TE0 input situation, and the bottom figures are the TM0 input situation. The inset in figure (c) demonstrates the alignment error, and the dashed–dotted line is the center line of the lower waveguide. The inset in figure (d) demonstrates the etching depth deviation, and the dashed–dotted line is the upper surface of the lower waveguide. Transmission efficiencies below −30 dB are not shown.
    Fig. 6. Simulated the transmission efficiencies varied with (a) the higher waveguide width deviation, (b) the lower waveguide width deviation, (c) the alignment error, and (d) the etching depth deviation. The transmission efficiencies of 1310 nm wavelength are the dashed line, and that of the 1550 nm wavelength are the solid line. The above figures are the TE0 input situation, and the bottom figures are the TM0 input situation. The inset in figure (c) demonstrates the alignment error, and the dashed–dotted line is the center line of the lower waveguide. The inset in figure (d) demonstrates the etching depth deviation, and the dashed–dotted line is the upper surface of the lower waveguide. Transmission efficiencies below 30dB are not shown.
    StructureDirectional coupler [10]T-waveguide and asymmetrical Y-junction [14]L-waveguide and asymmetrical Y-junction (our device)
    ILN/A0.4 dB0.27 dB
    ER25 dB12 dB14 dB
    Bandwidth300 nm400 nm500 nm
    Length400 μm95 μm84 μm
    Min linewidth150 nm (gap)0 nm (tip)400 nm
    CladdingSi3N4SiO2SiO2
    Table 1. Comparison of the PRSs With Bandwidths Greater Than 300  nm
    Daigao Chen, Xi Xiao, Lei Wang, Wen Liu, Qi Yang. Polarization rotator-splitter covering full optical communication bands based on L-shaped cross-section waveguide[J]. Chinese Optics Letters, 2016, 14(4): 041301
    Download Citation