Author Affiliations
1Heilongjiang Province Key Laboratory of Laser Spectroscopy Technology and Application, Harbin University of Science and Technology, Harbin, Heilongjiang 150080, China2Department of Computer Science, Chubu University, Aichi 487- 8501, Japanshow less
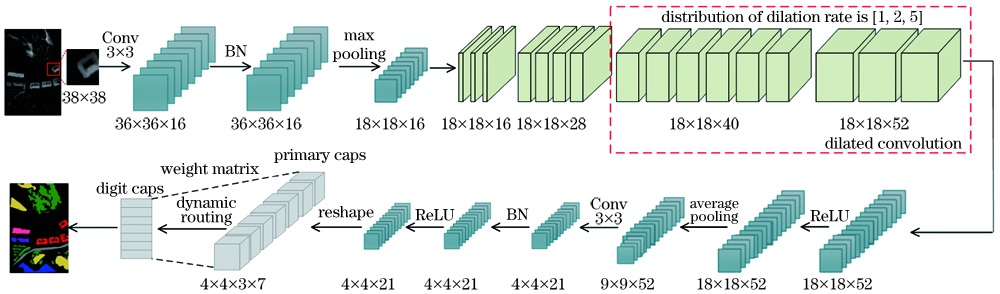
Fig. 1. Structure of dilated convolution capsule network
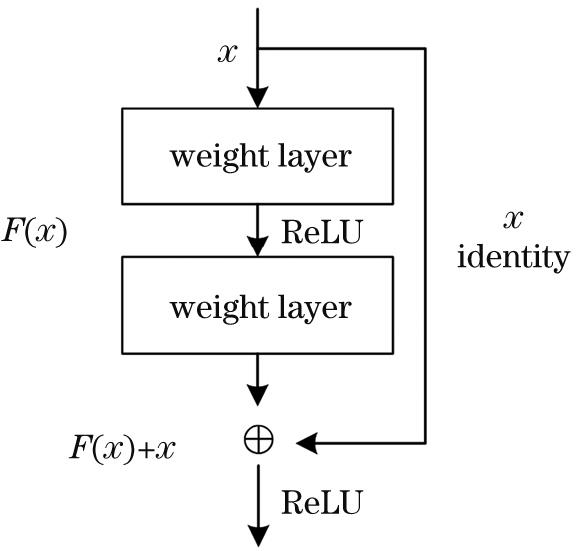
Fig. 2. Residual block structure
Fig. 3. Dilated convolution with different dilation rates. (a) r=1; (b) r=2; (c) r=3
Fig. 4. Odd-even mixed dilation rates. (a) r=5; (b) r=2; (c) r=1
Fig. 5. Capsule network structure
Fig. 6. Capsule structure
Fig. 7. DSM and groundtruth map of Bayview Park dataset. (a) DSM; (b) groundtruth map
Fig. 8. DSM and groundtruth map of Recology dataset. (a) DSM; (b) groundtruth map
Fig. 9. Dilation rate distribution of different datasets. (a) Bayview Park dataset; (b) Recology dataset
Fig. 10. Classification results of Bayview Park dataset. (a) Groundtruth map; (b) SVM; (c) Random Forest; (d) CNN; (e) CapsNet; (f) ResNet; (g) Dilated-ResNet; (h) ResCapsNet; (i) DCCN
Fig. 11. Classification results of Recology dataset. (a) Groundtruth map; (b) SVM; (c) Random Forest; (d) CNN; (e) CapsNet; (f) ResNet; (g) Dilated-ResNet; (h) ResCapsNet; (i) DCCN
| Layer name | Output size | ResNet-34 parameter setting |
|---|
| Conv 1 | 18×18 | 3×3, 16, stride 1 | | Conv2_x | 18×18 | 3×3 max pooling, stride 2×3 | | Conv3_x | 18×18 | ×4 | | Conv4_x,distribution ofdilation rate is[1,2,5] | 18×18 | ×6 | | Conv5_x,distribution ofdilation rate is[1,2,5] | 18×18 | ×3 | | Output | 9×9 | average pooling, stride 2 |
|
Table 1. ResNet-34 model parameters
| Training sample | Index | 400 | 500 | 600 | 700 |
|---|
| OA /% | 72.30±2.07 | 75.27±1.36 | 75.36±2.02 | 76.75±0.76 | | SVM | AA /% | 76.98±1.42 | 78.50±2.10 | 78.86±1.12 | 81.20±2.27 | | 100K | 65.22±1.79 | 66.36±0.95 | 67.65±1.72 | 69.12±2.23 | | OA /% | 86.56±0.75 | 87.34±0.62 | 88.23±0.34 | 90.56±0.47 | | Random Forest | AA /% | 88.94±1.52 | 89.12±0.23 | 89.45±0.38 | 90.14±0.73 | | 100K | 82.66±0.24 | 83.61±0.38 | 84.26±0.39 | 86.73±0.64 | | OA /% | 87.23±2.01 | 88.12±0.96 | 88.52±0.43 | 90.72±1.69 | | CNN | AA /% | 88.70±1.13 | 89.63±2.71 | 89.96±1.65 | 90.23±0.68 | | 100K | 83.26±1.45 | 85.25±1.46 | 86.23±1.78 | 86.72±2.34 | | OA /% | 85.43±1.12 | 87.25±0.89 | 90.07±1.08 | 90.73±0.36 | | CapsNet | AA /% | 84.26±1.78 | 88.26±1.38 | 91.14±1.35 | 91.86±1.52 | | 100K | 81.21±0.81 | 83.19±0.69 | 86.81±1.45 | 86.92±1.22 | | OA /% | 90.25±1.73 | 92.16±1.26 | 93.26±1.21 | 94.59±1.20 | | ResNet | AA /% | 91.53±1.38 | 93.23±0.81 | 94.25±1.06 | 95.86±1.25 | | 100K | 87.15±1.49 | 89.46±1.48 | 91.26±1.77 | 93.49±1.28 | | OA /% | 91.32±0.45 | 93.16±0.75 | 93.89±0.34 | 95.84±1.25 | | Dilated-ResNet | AA /% | 92.67±0.76 | 94.09±1.06 | 95.27±0.87 | 96.42±1.08 | | 100K | 88.46±1.05 | 91.58±0.57 | 92.65±0.65 | 94.15±1.34 | | OA /% | 93.15±0.52 | 94.79±0.41 | 94.59±0.73 | 96.42±0.71 | | ResCapsNet | AA /% | 94.27±0.43 | 95.42±0.90 | 96.03±0.75 | 97.01±1.07 | | 100K | 90.49±1.00 | 92.48±0.47 | 93.23±0.75 | 94.99±1.17 | | OA /% | 93.48±0.39 | 94.51±047 | 95.45±0.60 | 97.07±0.54 | | DCCN | AA /% | 94.97±0.44 | 95.39±0.61 | 95.90±0.74 | 97.70±0.20 | | 100K | 91.36±0.57 | 92.79±0.42 | 94.02±0.72 | 96.14±0.71 |
|
Table 2. Classification results of different training samples on Bayview Park dataset
| Training sample | Index | 400 | 500 | 600 | 700 |
|---|
| OA /% | 72.68±1.89 | 76.83±0.26 | 76.94±2.25 | 77.25±0.86 | | SVM | AA /% | 77.20±1.22 | 78.69±1.87 | 78.73±1.08 | 81.28±2.33 | | 100K | 67.22±1.79 | 68.42±0.98 | 68.82±1.59 | 69.78±2.24 | | OA /% | 85.24±1.25 | 87.33±0.74 | 89.20±1.88 | 91.75±1.00 | | Random Forest | AA /% | 88.36±1.92 | 89.85±3.06 | 90.27±1.26 | 91.29±1.41 | | 100K | 82.25±0.88 | 86.26±1.57 | 86.59±1.97 | 89.22±1.34 | | OA /% | 86.26±1.48 | 88.24±0.98 | 90.52±0.68 | 92.73±1.86 | | CNN | AA /% | 89.16±2.84 | 90.15±0.29 | 90.67±1.24 | 92.44±2.34 | | 100K | 83.18±1.59 | 86.78±0.67 | 86.83±0.88 | 90.15±2.17 | | OA /% | 80.73±1.07 | 84.92±1.67 | 86.75±0.43 | 90.26±1.24 | | CapsNet | AA /% | 81.93±1.94 | 86.29±1.08 | 86.95±1.09 | 91.26±1.99 | | 100K | 76.79±1.68 | 81.67±0.85 | 83.92±0.76 | 88.37±1.52 | | OA /% | 90.58±1.92 | 93.56±1.42 | 95.57±0.76 | 95.83±0.99 | | ResNet | AA /% | 88.86±2.14 | 94.52±1.22 | 94.33±1.32 | 95.36±1.88 | | 100K | 88.84±2.34 | 93.04±1.70 | 94.98±0.84 | 95.24±1.27 | | OA /% | 92.07±0.98 | 93.75±0.34 | 94.87±0.54 | 95.89±0.76 | | Dilated-ResNet | AA /% | 93.76±0.67 | 94.88±0.96 | 95.98±1.25 | 96.34±0.38 | | 100K | 90.67±0.34 | 92.39±1.07 | 94.77±1.15 | 95.09±0.47 | | OA /% | 93.44±1.21 | 94.35±1.23 | 96.07±0.48 | 96.31±0.73 | | ResCapsNet | AA /% | 94.63±0.17 | 95.22±060 | 97.16±1.15 | 97.30±0.17 | | 100K | 91.29±0.70 | 93.79±0.99 | 95.33±0.63 | 95.43±0.31 | | OA /% | 94.01±0.36 | 94.99±0.96 | 96.42±0.63 | 96.98±0.76 | | DCCN | AA /% | 94.97±0.58 | 95.67±0.46 | 97.49±0.69 | 97.77±0.78 | | 100K | 93.28±0.34 | 94.35±0.99 | 96.06±0.70 | 96.41±0.90 |
|
Table 3. Classification results of different training samples on Recology dataset
| Classe | SVM | RandomForest | CNN | CapsNet | ResNet | Dilated-ResNet | ResCapsNet | DCCN |
|---|
| Building1 | 82.20±3.72 | 95.24±3.75 | 93.53±1.50 | 94.28±1.45 | 98.26±1.55 | 98.96±1.04 | 99.36±0.64 | 99.74±0.26 | | Building2 | 84.59±2.58 | 98.83±1.03 | 92.72±1.08 | 95.22±2.03 | 99.64±0.36 | 99.78±0.22 | 99.79±0.21 | 99.54±0.46 | | Building3 | 91.36±4.96 | 100 | 92.90±1.50 | 93.32±1.93 | 99.57±0.43 | 99.68±0.32 | 100 | 99.69±0.31 | | Road | 81.60±4.43 | 82.59±6.35 | 91.36±1.58 | 94.90±1.20 | 96.38±2.65 | 97.09±2.83 | 98.12±1.22 | 98.82±1.18 | | Trees | 83.78±1.69 | 90.43±1.20 | 86.79±1.82 | 92.82±1.79 | 97.65±0.82 | 98.06±0.76 | 98.67±0.88 | 98.39±0.36 | | Soil | 62.23±2.27 | 86.78±0.52 | 85.59±1.71 | 83.56±0.80 | 86.95±1.62 | 87.47±1.52 | 89.32±2.06 | 90.98±1.39 | | Seawater | 86.79±2.48 | 84.21±1.25 | 90.75±2.74 | 85.53±1.23 | 91.18±2.87 | 91.88±2.65 | 93.47±2.30 | 94.79±1.17 |
|
Table 4. Classification results of each class for 700 samples on Bayview Park dataset unit:%
| Classe | SVM | RandomForest | CNN | CapsNet | ResNet | Dilated-ResNet | ResCapsNet | DCCN |
|---|
| Building1 | 71.78±1.21 | 92.56±2.78 | 98.78±1.22 | 92.29±1.29 | 98.75±1.25 | 98.86±1.14 | 98.06±1.74 | 98.97±0.32 | | Building2 | 64.54±1.77 | 94.67±3.75 | 96.52±1.42 | 94.45±1.36 | 99.24±0.76 | 99.02±0.98 | 99.46±0.54 | 99.82±0.18 | | Building3 | 92.78±1.20 | 94.24±1.44 | 94.16±1.25 | 93.47±1.35 | 98.42±1.58 | 98.56±1.44 | 98.41±1.16 | 98.04±0.96 | | Building4 | 90.39±2.47 | 97.88±0.24 | 97.55±1.36 | 95.16±1.01 | 95.41±1.72 | 97.52±2.31 | 99.67±0.33 | 98.24±1.76 | | Building5 | 86.26±1.73 | 96.30±2.77 | 97.48±2.38 | 98.06±1.94 | 99.86±0.14 | 99.07±0.93 | 98.72±1.28 | 99.55±0.45 | | Building6 | 71.52±1.62 | 95.27±1.36 | 94.37±1.07 | 87.47±1.59 | 96.85±2.34 | 97.26±1.09 | 98.35±1.65 | 97.06±2.83 | | Building7 | 88.37±2.74 | 97.26±2.74 | 97.48±1.95 | 95.86±2.15 | 92.43±2.53 | 95.97±1.75 | 98.79±1.21 | 99.51±0.49 | | Trees | 86.88±1.24 | 95.67±0.21 | 95.64±1.24 | 90.14±0.35 | 97.48±1.85 | 96.47±1.66 | 95.54±1.31 | 97.32±1.55 | | Parking Lot | 62.77±1.92 | 76.21±0.18 | 77.86±1.87 | 83.39±0.14 | 89.45±1.75 | 89.29±1.06 | 89.28±1.27 | 91.31±0.58 | | Soil | 81.83±3.22 | 73.16±0.32 | 73.29±1.72 | 75.41±1.45 | 88.69±2.47 | 90.66±2.54 | 95.68±2.43 | 96.92±3.08 | | Grass | 97.77±1.37 | 98.26±1.25 | 97.26±1.58 | 98.26±1.42 | 92.54±2.46 | 93.48±2.49 | 95.52±2.61 | 99.61±0.39 |
|
Table 5. Classification results of each class for 700 samples on Recology dataset unit:%
| Dataset | Network | Traintime /s | Testtime /s | OA /% |
|---|
| ResNet | 125.15 | 1.82 | 94.51 | | Dilated-ResNet | 195.34 | 2.76 | 95.67 | | BayviewPark | CapsNet | 99.58 | 2.18 | 90.73 | | ResCapsNet | 343.85 | 3.00 | 96.42 | | DCCN | 518.65 | 3.75 | 97.07 | | ResNet | 196.34 | 2.67 | 95.83 | | Dilated-ResNet | 257.98 | 2.98 | 96.36 | | Recology | CapsNet | 94.27 | 1.39 | 90.26 | | ResCapsNet | 428.69 | 3.34 | 96.31 | | DCCN | 586.55 | 3.96 | 96.98 |
|
Table 6. Comparison of calculation time for 700 samples on Recology dataset and Bayview Park dataset