
Jieliang Ye, Yueqiao Feng, Zhuguo Li, Xunguo Zhang. Composition Design, Microstructures and Properties of Fe‑Based Wear‑ and Corrosion‑Resistant Coatings by Laser Cladding[J]. Chinese Journal of Lasers, 2023, 50(12): 1202210
- Chinese Journal of Lasers
- Vol. 50, Issue 12, 1202210 (2023)
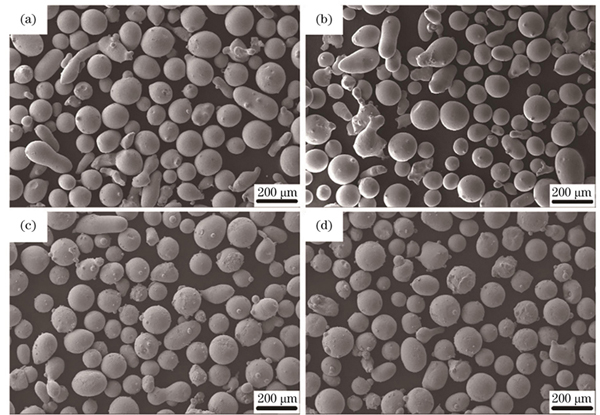
Fig. 1. Photos of Fe-based alloy powders captured by scanning electron microscopy. (a) S1 powder; (b) S2 powder; (c) S3 powder;
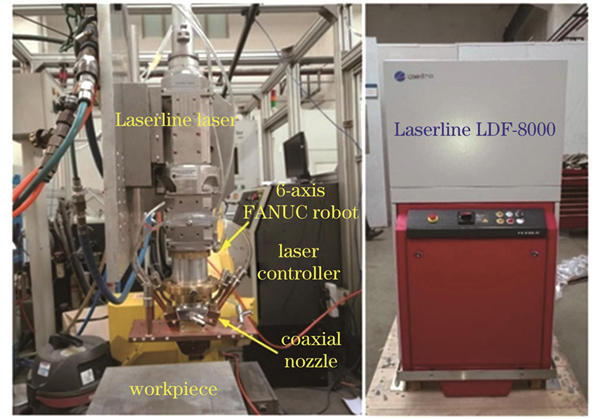
Fig. 2. High power semiconductor laser cladding system
Fig. 3. Orthogonal test results. (a)-(i) Macroscopic morphologies of caldding layers prepared by technical parameters of No.1-9 in orthogonal test parameter table; (j) measurement results of cladding layer thickness, width of heat affected zone and dilution rate; (k) range analysis
Fig. 4. Macroscopic appearances and microstructures of cladding layers surface. (a) Macroscopic appearance; (b)-(e) microstructures of S1, S2, S3, S4 cladding layers
Fig. 5. Morphologies and EDS maps of cladding layers. (a)(e) S1 cladding layer; (b)(f) S2 cladding layer; (c)(g) S3 cladding layer;
Fig. 6. EBSD maps of cladding layers. (a) S1 cladding layer; (b) S2 cladding layer; (c) S4 cladding layer
Fig. 7. Vickers hardness and friction and wear properties of cladding layers and base material 42CrMo. (a) Vickers hardness; (b) friction and wear properties
Fig. 8. Surface condition of cladding layers and base material after salt spray corrosion test. (a) S1 cladding layer; (b) S2 cladding layer; (c) S3 cladding layer; (d) S4 cladding layer; (e) base material 42CrMo
Fig. 9. Corrosion mass loss of cladding layers and base material
Fig. 10. Potentiodynamic polarization curves of cladding layer and base material
|
Table 1. Chemical composition of base material
| |||||||||||||||||||||||||||||||||||||||||||||||||||||||||||
Table 2. Chemical composition of four kinds of Fe-based alloy powders
| |||||||||||||||||||||||||||||||||||||||||||
Table 3. Technological parameters of L9(34) orthogonal test
| |||||||||||||||||||||||||||||||||||||||||||||||||||||||||||
Table 4. Element map scanning of each cladding layer
|
Table 5. Electrochemical parameters acquired from polarization curves

Set citation alerts for the article
Please enter your email address
© Copyright 2018-2021 | Chinese Laser Press. All Rights Reserved 沪ICP备15018463号-20