• Chinese Journal of Lasers
  • Vol. 51, Issue 5, 0513002 (2024)
Yanyan Qin1、2, Ruidong Huang1、2, Xiaobing Liu1, Cheng Qian1、3, Siming Xue1, and Qinghe Mao1、2、*
Author Affiliations
  • 1Anhui Provincial Key Laboratory of Photonics Devices and Materials, Anhui Institute of Optical and Fine Mechanics, Hefei Institutes of Physical Science, Chinese Academy of Sciences, Hefei 230031, Anhui, China
  • 2University of Science and Technology of China, Hefei 230026, Anhui, China
  • 3Institutes of Physical Science and Information Technology, Anhui University, Hefei 230039, Anhui, China
  • show less
    DOI: 10.3788/CJL231356 Cite this Article Set citation alerts
    Yanyan Qin, Ruidong Huang, Xiaobing Liu, Cheng Qian, Siming Xue, Qinghe Mao. Batch Preparation and Quantitative Detection of Tapered SERS Fiber Probes[J]. Chinese Journal of Lasers, 2024, 51(5): 0513002 Copy Citation Text show less
    Batch preparation device and effect diagram of tapered fiber SERS probes. (a) Schematic of disc with circular through holes, in which diameter and thickness of disk are 10.0 mm and 3.0 mm, and diameter and spacing of circular through holes are 400.0 μm and 2.5 mm respectively; (b) distribution of golden sphere particles on tapered surface of prepared fiber SERS probe after 2 h electrostatic adsorption with local enlarged picture of dotted box area shown in inset
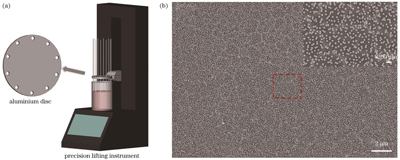
    Fig. 1. Batch preparation device and effect diagram of tapered fiber SERS probes. (a) Schematic of disc with circular through holes, in which diameter and thickness of disk are 10.0 mm and 3.0 mm, and diameter and spacing of circular through holes are 400.0 μm and 2.5 mm respectively; (b) distribution of golden sphere particles on tapered surface of prepared fiber SERS probe after 2 h electrostatic adsorption with local enlarged picture of dotted box area shown in inset
    Experimental setup of SERS test for tapered fiber probes
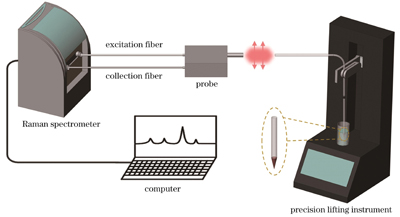
    Fig. 2. Experimental setup of SERS test for tapered fiber probes
    Detection results of tapered fiber SERS probes. (a) SERS spectra of 10-6 mol/L thiram standard solution measured by 10 tapered fiber probes in same batch; (b) average SERS spectra of 10-6 mol/L thiram standard solutions measured by 6 different batches of probes; (c) spectral amplitudes of Raman peaks at 1386 cm-1 and corresponding SDs in SERS average spectra measured by 6 different batches of probes
    Fig. 3. Detection results of tapered fiber SERS probes. (a) SERS spectra of 10-6 mol/L thiram standard solution measured by 10 tapered fiber probes in same batch; (b) average SERS spectra of 10-6 mol/L thiram standard solutions measured by 6 different batches of probes; (c) spectral amplitudes of Raman peaks at 1386 cm-1 and corresponding SDs in SERS average spectra measured by 6 different batches of probes
    Fitted curves of spectral amplitude of Raman characteristic peak at 1386 cm-1 for thiram solutions (square is data and line is fitted line)
    Fig. 4. Fitted curves of spectral amplitude of Raman characteristic peak at 1386 cm-1 for thiram solutions (square is data and line is fitted line)
    Quantitative curves before and after spectral data assimilation. (a) Quantitative curves before spectral data assimilation; quantitative curves after spectral data assimilation based on quantitative relationship curves of batch (b) 1, (c) 4 and (d) 8 fiber probes (square is data and line is fitted line)
    Fig. 5. Quantitative curves before and after spectral data assimilation. (a) Quantitative curves before spectral data assimilation; quantitative curves after spectral data assimilation based on quantitative relationship curves of batch (b) 1, (c) 4 and (d) 8 fiber probes (square is data and line is fitted line)

    Concentration

    of spiked

    sample

    C1'C2'C3'C4'C5'C6'C7'C8'C9'C10'C'
    8.00×10-77.51×10-76.10×10-77.06×10-78.42×10-76.53×10-75.65×10-78.16×10-79.46×10-78.07×10-75.92×10-77.31×10-7
    8.00×10-89.28×10-87.58×10-81.14×10-77.35×10-88.34×10-88.66×10-87.01×10-87.84×10-88.68×10-89.06×10-88.49×10-8
    Table 1. Detected concentrations of spiked samples before and after spectral data assimilation

    Concentration of

    spiked sample /(mol·L-1

    R1 /%R2 /%R3 /%R4 /%R5 /%R6 /%R7 /%R8 /%R9 /%R10 /%R /%
    8.00×10-793.976.388.3105.381.670.6102.0118.3100.974.091.4
    8.00×10-8116.094.8142.591.9104.3108.387.698.0108.5113.3106.1
    Table 2. Detected recovery rates before and after spectral data assimilation
    Yanyan Qin, Ruidong Huang, Xiaobing Liu, Cheng Qian, Siming Xue, Qinghe Mao. Batch Preparation and Quantitative Detection of Tapered SERS Fiber Probes[J]. Chinese Journal of Lasers, 2024, 51(5): 0513002
    Download Citation