• Chinese Journal of Chemical Physics
  • Vol. 33, Issue 5, 649 (2020)
Fang-fang Li, Yu-jie Ma, Jia-xing Liu, Guan-jun Wang, and Feng-yan Wang*
DOI: 10.1063/1674-0068/cjcp2007118 Cite this Article
Fang-fang Li, Yu-jie Ma, Jia-xing Liu, Guan-jun Wang, Feng-yan Wang. Photodissociation Dynamics of AlO at 193 nm using Time-Sliced Ion Velocity Imaging[J]. Chinese Journal of Chemical Physics, 2020, 33(5): 649 Copy Citation Text show less
(a) The raw image of Al+ with O\begin{document}$ _2 $\end{document} as carrier gas recorded at 193 nm and (b) nearly a quarter part of the enlarged image, in which the inner ring (region A) has a lower velocity and the angular distribution tends to be isotropic compared to that of the outer region (region B). The polarization direction of the laser is shown in the figure.
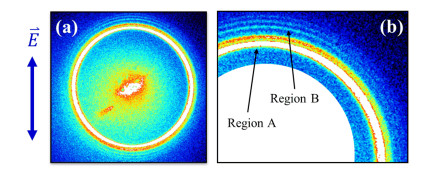
Fig. 1. (a) The raw image of Al+ with O\begin{document}$ _2 $\end{document} as carrier gas recorded at 193 nm and (b) nearly a quarter part of the enlarged image, in which the inner ring (region A) has a lower velocity and the angular distribution tends to be isotropic compared to that of the outer region (region B). The polarization direction of the laser is shown in the figure.
Speed distributions of Al+ ions obtained from the integration of images over (a) an entire range of 0\begin{document}$ ^{\circ} $\end{document}-360\begin{document}$ ^{\circ} $\end{document} and (b) the small angular range of 0\begin{document}$ ^{\circ} $\end{document}\begin{document}$ \pm $\end{document}5\begin{document}$ ^{\circ} $\end{document} for a better resolution.
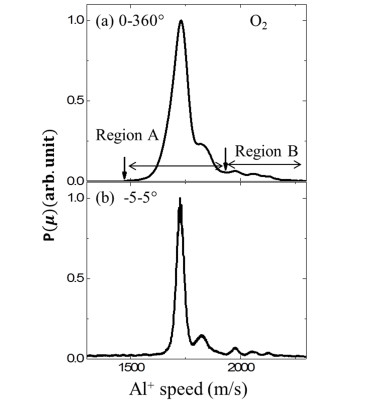
Fig. 2. Speed distributions of Al+ ions obtained from the integration of images over (a) an entire range of 0\begin{document}$ ^{\circ} $\end{document}-360\begin{document}$ ^{\circ} $\end{document} and (b) the small angular range of 0\begin{document}$ ^{\circ} $\end{document}\begin{document}$ \pm $\end{document}5\begin{document}$ ^{\circ} $\end{document} for a better resolution.
Total kinetic energy distribution of Al/Al++O converted from FIG. 2(b).
Fig. 3. Total kinetic energy distribution of Al/Al++O converted from FIG. 2(b).
Angular distributions of Al+ ions in (a) Al(\begin{document}$ ^2 $\end{document}P\begin{document}$ _ \rm{u} $\end{document})+O(\begin{document}$ ^3 $\end{document}P\begin{document}$ _ \rm{g} $\end{document}) channel and (b) Al+(\begin{document}$ ^1 $\end{document}S\begin{document}$ _ \rm{g} $\end{document})+O(\begin{document}$ ^3 $\end{document}P\begin{document}$ _ \rm{g} $\end{document}) channel obtained from AlO(\begin{document}$ v $\end{document} = 0, 1, and 2), respectively.
Fig. 4. Angular distributions of Al+ ions in (a) Al(\begin{document}$ ^2 $\end{document}P\begin{document}$ _ \rm{u} $\end{document})+O(\begin{document}$ ^3 $\end{document}P\begin{document}$ _ \rm{g} $\end{document}) channel and (b) Al+(\begin{document}$ ^1 $\end{document}S\begin{document}$ _ \rm{g} $\end{document})+O(\begin{document}$ ^3 $\end{document}P\begin{document}$ _ \rm{g} $\end{document}) channel obtained from AlO(\begin{document}$ v $\end{document} = 0, 1, and 2), respectively.
Fang-fang Li, Yu-jie Ma, Jia-xing Liu, Guan-jun Wang, Feng-yan Wang. Photodissociation Dynamics of AlO at 193 nm using Time-Sliced Ion Velocity Imaging[J]. Chinese Journal of Chemical Physics, 2020, 33(5): 649
Download Citation