• Journal of Natural Resources
  • Vol. 35, Issue 8, 1908 (2020)
Shan-dong NIU1、2, Bin FANG2、3、*, Cui CUI2, and Shi-hui HUANG2
Author Affiliations
  • 1Northeastern University, School of Humanities and Law, Shenyang 110169, China
  • 2School of Geography Science, Nanjing Normal University, Nanjing 210023, China
  • 3Nanjing Normal University Rural Revitalization Research Institute, Nanjing 210023, China
  • show less
    DOI: 10.31497/zrzyxb.20200812 Cite this Article
    Shan-dong NIU, Bin FANG, Cui CUI, Shi-hui HUANG. The spatial-temporal pattern and path of cultivated land use transition from the perspective of rural revitalization: Taking Huaihai Economic Zone as an example[J]. Journal of Natural Resources, 2020, 35(8): 1908 Copy Citation Text show less
    The concept framework of cultivated land use transition
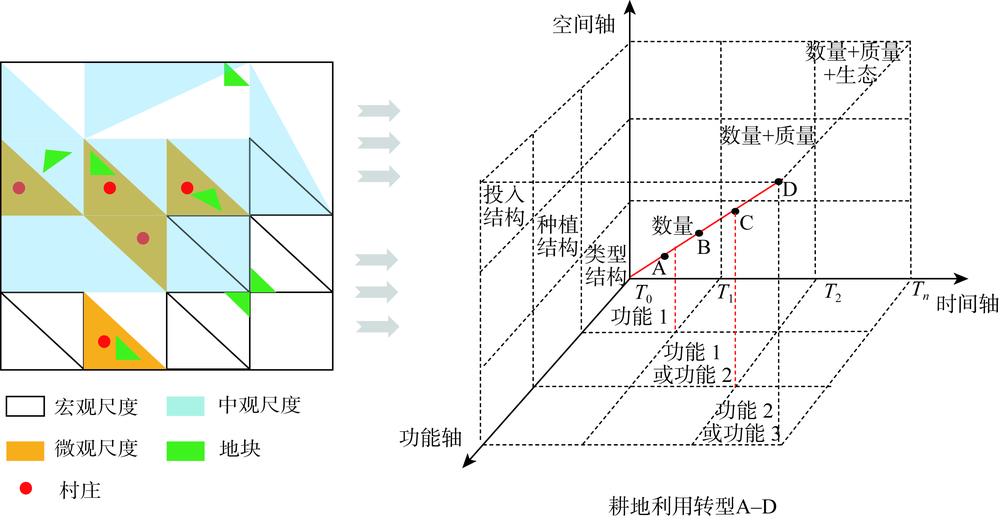
    Fig. 1. The concept framework of cultivated land use transition
    The logical relationship between rural revitalization and cultivated land use transition
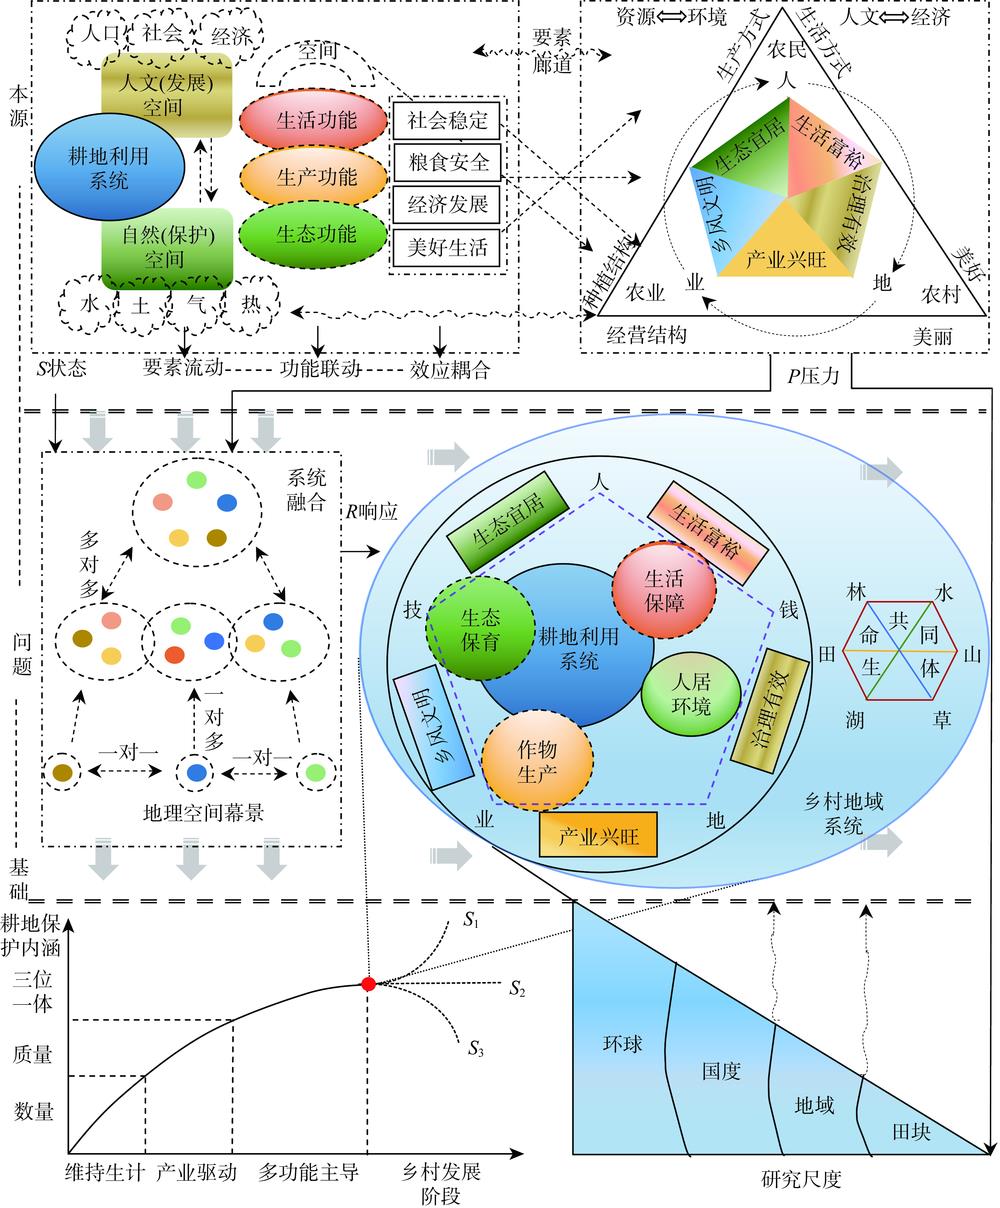
    Fig. 2. The logical relationship between rural revitalization and cultivated land use transition
    Location of Huaihai Economic Zone
    Fig. 3. Location of Huaihai Economic Zone
    Evolution of spatial pattern of cultivated land use space transition
    Fig. 4. Evolution of spatial pattern of cultivated land use space transition
    Evolution of spatial pattern of cultivated land use function transition
    Fig. 5. Evolution of spatial pattern of cultivated land use function transition
    Local spatial correlation map of cultivated land use transition
    Fig. 6. Local spatial correlation map of cultivated land use transition
    Path of gravity center of cultivated land use transition
    Fig. 7. Path of gravity center of cultivated land use transition
    Geo-spectra of cultivated land use transition path
    Fig. 8. Geo-spectra of cultivated land use transition path
    决策层目标层因素层指标层单位指标权重性质指标解释
    耕地
    利用
    转型
    空间
    转型
    数量
    (SL)
    人均耕地面积hm2/人0.0423+耕地面积/农村人口,反映耕地数量变化
    土地垦殖率%0.0357+耕地面积/土地总面积,反映耕地面积变化
    结构
    (JG)
    复种指数%0.0282+农作物总播种面积/耕地总面积,反映耕地利用程度
    省增投入比/0.0282+劳均农业机械总动力/地均化学品投入,即省工性投入/增产性投入,反映耕地投入结构变化
    粮食作物播种面积比例%0.0279+粮食作物种植面积/耕地总面积,反映种植类型变化
    粮经比%0.2463+粮食作物产量/经济作物产量,反映种植结构变化
    功能
    转型
    生产
    功能
    (SC)
    地均种植业总产值元/hm20.1229+种植业总产值/耕地面积,反映耕地生产价值
    地均粮食产量kg/hm20.0487+粮食总产量/粮食作物播种面积,反映耕地粮食生产能力
    地均劳动力数量人/hm20.0593+种植业从业人员/耕地面积,反映耕地生产效率
    生活
    功能
    (SH)
    人均农业收入占比%0.0444+农村人均种植业增加值/农村人均纯收入,反映耕地经济生活保障功能
    人均粮食保证率%0.0783+粮食产量/(常住人口×400 kg),反映耕地粮食保障功能
    种植业从业比例%0.0640+种植业从业人员/总劳动力人口,反映耕地就业保障功能
    生态
    功能
    (ST)
    地均化肥面源污染强度kg/hm20.0795-式(1),反映耕地对生态环境的承载能力
    农作物种类多样性/0.0301+式(2),反映耕地生态系统恢复能力
    乡土文化离散度/0.0642+农田生态系统生态服务价值中文化平均单位面积服务价值,反映乡村文化传承功能
    Table 1. Evaluation system of cultivated land use transition
    城市2002年2007年2012年2017年
    徐州0.125620.181630.187000.17708
    盐城0.110050.135560.153180.16000
    淮安0.128760.151240.169360.18782
    连云港0.123970.145310.178670.20091
    宿迁0.153640.152870.184070.21015
    蚌埠0.139870.147230.167790.15830
    亳州0.113770.118400.137830.13726
    阜阳0.127370.133230.168620.18638
    淮北0.127520.141380.189720.24877
    宿州0.117750.132380.150200.13536
    枣庄0.168130.168240.204600.26838
    菏泽0.155460.159510.174560.20880
    济宁0.158690.141290.195360.21106
    莱芜0.169290.192130.233890.15689
    临沂0.155610.164010.172980.17232
    日照0.130330.143180.164490.16279
    泰安0.179050.147510.170540.16982
    周口0.170190.185390.203230.19097
    开封0.163300.168250.178680.16247
    商丘0.198300.187760.169730.19284
    Table 2. The index of cultivated land use composite transition
    类型年份
    2002200720122017
    空间转型0.38060***(2.9617)0.25032**(2.0724)0.19840(1.7243)-0.00168(0.3628)
    数量(SL)0.34636***(2.8249)0.55026***(4.1851)0.27969**(2.3304)0.13001**(1.3468)
    结构(JG)0.14570**(1.3420)0.07904(0.9173)0.02435(0.5437)-0.02735(0.1811)
    功能转型0.32956***(2.5020)0.08553(0.9296)0.22813**(2.0345)0.19680**(1.8489)
    生产功能(SC)0.03534(0.5997)0.06385(0.8409)0.09327**(1.3483)0.14987**(1.4527)
    生活功能(SH)0.16511**(0.4814)0.03170***(2.4682)0.11902**(1.2374)-0.11881(-0.4804)
    生态功能(ST)0.56295***(4.0119)0.60094***(4.3116)0.57031***(4.1603)0.53971***(3.9576)
    Table 3. The results of Global Moran's I
    类型时段/年
    2002—20072007—20122012—2017
    综合转型1.622701.022390.74252
    空间转型1.493990.335190.92198
    功能转型1.677591.022390.85747
    Table 4. Speed of gravity center of cultivated land use transition (km/年)
    Shan-dong NIU, Bin FANG, Cui CUI, Shi-hui HUANG. The spatial-temporal pattern and path of cultivated land use transition from the perspective of rural revitalization: Taking Huaihai Economic Zone as an example[J]. Journal of Natural Resources, 2020, 35(8): 1908
    Download Citation