
Jiayinghao LI, Yunju LI, Zhihong LI, Youbao WANG, Yangping SHEN, Bing GUO, Weiping LIU. Nuclear astrophysics research based on HI-13 tandem accelerator[J]. NUCLEAR TECHNIQUES, 2023, 46(8): 080002
- NUCLEAR TECHNIQUES
- Vol. 46, Issue 8, 080002 (2023)
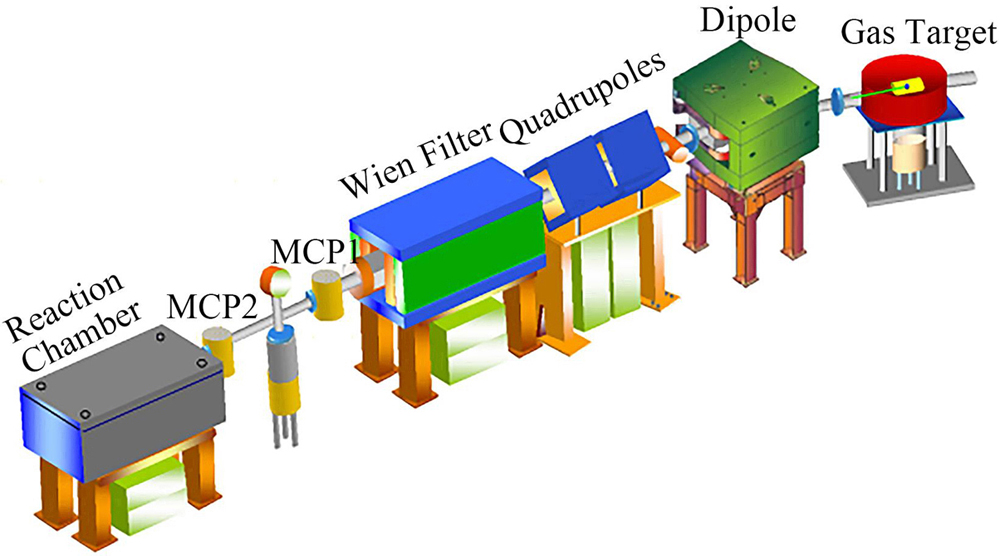
Fig. 1. Radioactive secondary beam line in HI-13 tandem accelerator
![Typical inverse kinematics experiment setup for radioactive beam[4]](/richHtml/hjs/2023/46/8/080002/img_02.jpg)
Fig. 2. Typical inverse kinematics experiment setup for radioactive beam[4]
Fig. 3. Angular distribution of 7Be(d, n)8B transfer reaction and DWBA fitting results[2]
Fig. 4. Comparison between astrophysical S-factor of 13N(p, γ)14O obtained by Nuclear Astrophysics Research Group and other results[3]
Fig. 5. Angular distribution of 8Li(d, p)9Li reaction and four DWBA results (a) and the astrophysics reaction rate of 8Li(n, γ)9Li (b)[4]
Fig. 6. Comparison between the angular distribution of 1H(6He, 6Li)n reaction and different DWBA results[21]
Fig. 7. Exciting function of 13N+p elastic resonance scattering and results analyzed by R -matrix[23]
Fig. 8. Exciting function of 17F+p elastic resonance scattering and results analyzed by R -matrix[25]
Fig. 9. Q3D magnetic spectrometer
Fig. 10. Two-dimensional position-sensitive X4 silicon detector array
Fig. 11. Angular distribution of 13C(7Li, 6He)14N reaction producing 14N ground state and the first excited state — the DWBA results reproduced the experimental data well[29]
Fig. 12. Angular distribution of 13C(9Be, 8Li)14N reaction and four sets of theoretical calculation results[30]
Fig. 13. Effect spectrum and background spectrum of 25Mg(7Li, 6He)26Al reaction[32]
Fig. 14. Angular distribution and calculation results of 15N(7Li, 6Li)16N reaction[33]
Fig. 15. Comparison of results of astrophysical reaction rates of 13C(α, n)16O[42]
Fig. 16. Astrophysical SE2 factor of 12C(α, γ)16O[52]The data points represent the results of direct measurement (the uncertainty is 56%), the solid line represents the result of considering the data of 16O ground state ANC (the uncertainty is reduced to 10%), and, compared with the latest value recommended by RMP (dashed line)[53], the new results increase by 55%.
Fig. 17. Relationship between the black hole mass and the initial mass of the He core of a star, which finally forms the black hole (a), and data of black hole mass measured by LIGO and Virgo (b)[54]. In the Fig.(a), the point and dashed line below are, respectively, the upper and lower limits based on the present work, and the point and dashed line above are, respectively, the upper and lower limits based on the latest review of reaction rates. There is an obvious difference between the two results.
|
Table 1. Radioactive nuclear beams produced by GIRAFFE

Set citation alerts for the article
Please enter your email address
© Copyright 2018-2021 | Chinese Laser Press. All Rights Reserved 沪ICP备15018463号-20