Xu Yan, Haiwei Fu, Huidong Li, Xueguang Qiao, "Simultaneous refractive index and temperature measurements by using dual interference in an all-fiber Mach–Zehnder interferometer," Chin. Opt. Lett. 14, 030603 (2016)
Copy Citation Text
A Fourier analysis applied to the Mach–Zehnder interferometer (MZI) transmission spectrum for simultaneous refractive index (RI) and temperature measurements is proposed and experimentally demonstrated in this Letter. In the fast Fourier transform (FFT) spectrum of the MZI transmission spectrum, several frequency components are generally observed, which means that the transmission spectrum of the MZI is formed by the superposition of some dual-mode interference (DMI) spectra, and each frequency component represents different core-cladding interferences. We can select some dominant frequency components in the FFT spectrum of the MZI transmission spectrum to take the inverse FFT (IFFT). Then, the corresponding DMI patterns can be obtained. Due to the shift of the wavelength of these DMI spectra with changes in the environmental parameters, we can use the coefficient matrix of these DMI spectra for multi-parameter sensing. In this Letter, two DMI patterns are separated from the resultant transmission spectrum of the MZI. As the RI and temperature change, the shifts of the two DMI patterns with respect to the RI and temperature will be observed. The sensitivities of the RI and temperature are (RI unit) and , and and for the two DMIs. Accordingly, it can be used to simultaneously measure RI and temperature changes. The approach can eliminate the influence of multiple interferences and improve the accuracy of the sensor.
All-fiber Mach–Zehnder interferometer (MZI) sensors have attracted great attention due to their small size, high sensitivity, and ability to be directly embedded into the system structure, etc. So far, various types of all-fiber MZIs have been reported[1–14]. Dong et al. fabricated an MZI sensor based on a multimode polymer and a microhole drilled by a femtosecond laser for liquid refractive index (RI) sensing[5]. The sensor has a good linear response to the RI in a large dynamic range of 1.333–1.473. However, femtosecond laser fabrication is time consuming and expensive. Shao et al. presented an MZI sensor based on a single-mode fiber/thin-core fiber/multimode fiber/single-mode fiber (SMF-TCF-MMF-SMF) structure for RI measurement[6], in which both the TCF and MMF act as sensing arms. Therefore, the sensor is virtually a combined one with two cascaded MZIs, which is more complicated in an interference situation. Wang et al. proposed a high-sensitivity photonic crystal fiber (PCF) MZI sensor based on a tapered SMF-PCF-SMF for RI measurements[7]; this approach was also costly. MZIs have been used for RI sensing by monitoring the shift of the transmission spectrum. However, due to the thermo-optic effect and thermal expansion, MZI sensors are also sensitive to the temperature. Therefore, there is a potential temperature cross-sensitivity problem for the RI measurement. It is significant that the temperature can be measured simultaneously with the RI in the applications. MZI sensors for the simultaneous measurement of the RI and temperature can be attained by measuring the wavelength shifts of two specific interference orders in the MZI transmission spectrum[8–10]. However, in many previous studies[11–14], multiple interferences have frequently been observed between the core mode and cladding modes in the transmission spectrum of the MZI. The final measured specific peak (or dip) shift is an integrative result of all the peak (or dip) shifts of each excited cladding mode. The transmission spectra of different cladding modes shift at different rates relative to one another. Therefore, the simultaneous measurement of the RI and temperature cannot be reliably attained by monitoring the wavelength shifts of two specific interference orders in the MZI transmission spectrum[15]. To overcome this limitation, we propose a dual-interference method in this study. With our dual-interference method, two dual-mode interference (DMI) spectra representing different core-cladding interferences are separately extracted from the resultant transmission spectrum of the MZI by a Fourier analysis. As different DMI spectra have different RIs and temperature sensitivities, the simultaneous measurement of the RI and temperature has been achieved via the sensitivity matrix method. This way, we can eliminate the influence of multiple interferences and improve the measurement accuracy of the MZI. The proposed approach is experimentally investigated by a new all-fiber MZI constituted by single-mode/bitaper/multimode/single-mode/lateral offset joint/single-mode fiber structures. A bending-vector MZI sensor based on lateral offset and up-taper was proposed by Zhang et al.[16]. The configuration of the sensor is similar to ours, but the sensor components and measuring method are very different.
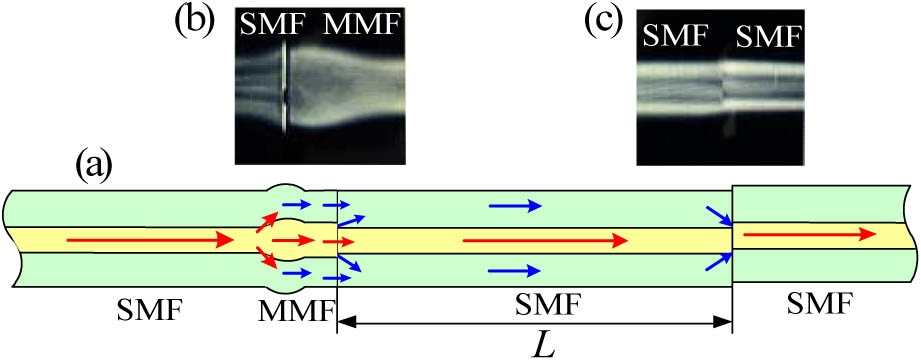
The schematic diagram of the proposed MZI sensor is shown in Fig. 1(a). An electrical arc method was employed to fabricate a bitaper and lateral offset using an FITEL S177B fusion splicer. The splice parameters are listed in Table 1. A conventional SMF is spliced to a short piece of MMF with a length of about 600 μm. These sections are taper spliced to an SMF at the left end and connected to another SMF at the right end with a small lateral offset. Figure 1(b) shows the profile of the bitaper with a waist diameter of 180 μm and a length of 281 μm. Figure 1(c) shows the profile of the core-offset section with a lateral offset size of 3.5 μm. The core/cladding diameters of the SMF and the step-index MMF are 9.2/125 and 40/125 μm, respectively. The input light begins to diffract when it enters the waist-enlarged fusion region and partly goes to the MMF core region. The light injected into the SMF from the MMF will re-excite several modes propagating within the cladding region of the SMF because of the fiber core mismatch. These cladding modes with different effective refractive indices travel a length along the sensing segment, finally re-coupling back to interfere with the core mode at the core-offset joint. Therefore, the transmission spectrum of the interferometer can be expressed as that of a multimode interference. Namely, the resultant transmission spectrum of the sensor is not a simple cosine curve as in a common dual-mode MZI, but a superposition of many cosine curves representing different DMIs[15]. As we know, any periodic signal can be decomposed into a series of harmonically related sinusoidal functions with specified amplitudes, frequencies, and phase offsets[17–19]. Based on this concept, the different DMI spectra can be separately demodulated from the resultant transmission spectrum of the sensor. We can extract the selected frequency component to take the inverse fast Fourier transform (IFFT) and obtain a DMI pattern between the core mode and cladding mode . The phase difference between the core mode and cladding mode traveling the same distance () can be expressed as , where is the differential effective RI between the core mode and the cladding mode, and is the light wavelength. The wavelength spacing between the adjacent attenuation peaks can be expressed by[20,21]
As the RI increases, the effective RI of the cladding mode will increase, but that of the core mode is hardly disturbed. This means that will decrease with the surrounding RI increase and a wavelength shift in the DMI pattern will be observed. As the temperature increases, both the effective RIs of the fiber core and cladding modes are increased due to the thermo-optic effect and thermal expansion. Since the thermo-optic coefficient and thermal expansion coefficient of the fiber core are higher than that of the fiber cladding, will increase as the temperature increases. Consequently, the interference spectrum will shift to a longer wavelength. When the RI and temperature are applied to the sensor, two different DMI patterns may exhibit different RI and temperature responses. Thus, the sensing performance of the sensor can be expressed by a matrix, as follows: where and are the wavelength shifts of the two DMI patterns; and are the applied RI and temperature changes, respectively; , , , and are the RI and temperature sensitivities of the two DMI patterns, respectively. The matrix coefficients can be obtained by separately measuring the RI and temperature responses of the two DMI patterns. In principle, the applied RI and the temperature changes can be obtained simultaneously though the use of a standard matrix inversion method:
Sign up for Chinese Optics Letters TOC. Get the latest issue of Chinese Optics Letters delivered right to you!Sign up now
The transmission spectrum of the sensor is measured by using an optical spectrum analyzer (OSA) integrated with a broadband light source (BBS). The wavelength resolution of the OSA (Anritsu, MS9740A) is 0.02 nm, and the BBS (Lightcomm, ASE–CL) bandwidth is 100 nm, as shown in Fig. 2. The spectrum of the interferometer with is shown in Fig. 3(a). In order to investigate the number and power distribution of the modes, Fig. 3(a) is Fourier transformed to get its corresponding spatial frequency spectrum, as shown in Fig. 3(b). It is shown that many modes construct the interference pattern, and the power is primarily distributed in the fundamental mode and two cladding modes with the spatial frequency located at and , respectively. The other cladding modes have little contribution to the interference pattern. This means that the transmission spectrum of the MZI is dominantly formed by the superposition of two DMI spectra. The two spatial frequency components are marked core-cladding 1 and core-cladding 2 for the following discussion.
Arc duration (t:ms)
Arc power (units)
Overlap size (L:μm)
Offset size (l:μm)
Bitaper
3000
100
140
0
Lateral offset
750
85
0
3.5
Table 1. Parameters of the Fabricated Interferometers
Figure 1.(a) Schematic configuration and principle of the proposed sensor. (b) Microscopic image of the bitaper. (c) Microscopic image of the core-offset joint.
The coupling efficiency has been changed between different core-cladding interfering modes in the proposed MZI, which is the main reason for the intensity differences among these interfering modes. The RI distribution around the mode coupler joints is highly dependent on the fusion splicing parameters (e.g., arc discharge power and arc discharge time) in the electric-arc method, which will influence the coupling efficiency.
For the RI measurement, the measurement sample used is a sucrose solution and the environment’s temperature is kept at room temperature. The transmission spectra are measured with several RIs calibrated by an Abbe refractometer at room temperature. Figure 4(a) shows the spectral response of the sensor with RIs ranging from 1.3333 to 1.4040. All the attenuation peak wavelengths become shorter. For the temperature measurement, Fig. 4(b) illustrates the spectral response of the sensor to temperature. In this experiment, the surrounding medium was water. The temperature performance was investigated by mounting the sensor on a tubular oven with temperature control range of 20°C to 90°C at intervals of 10°C. As the temperature increases, all the attenuation peak wavelengths become longer. However, Figs. 4(a) and 4(b) show that different interference peaks shift at different rates related to one another with the RI and temperature variation. It is thought that the multiple interference is the main cause of the different rates among the interference peaks.
Figure 4.Measured spectra with (a) RI variations and (b) temperature variations.
In order to analyze the characteristics of the measured transmission spectra in the Fourier domain, we take the fast Fourier transform (FFT) of the wavelength spectra in Figs. 4(a) and 4(b). Figures 5(a) and 5(b) are the Fourier spectra calculated from Figs. 4(a) and 4(b), respectively. An important feature in Fig. 5 is that the positions of the core-cladding 1 and core-cladding 2 are always fixed with the RI or temperature increment, which means that there are two stabilized interfering modes during the course of the experiment. This is critical in simultaneous RI and temperature measurements. We extract the core-cladding 1 and core-cladding 2 peaks in Fig. 5(a) to take the IFFT and get the wavelength spectra as Figs. 6(a) and 6(b) responding to the RI variation for corresponding DMIs. Similarly, the wavelength spectra in Figs. 7(a) and 7(b) that are responding to the temperature variation for corresponding DMIs can be obtained by extracting the core-cladding 1 and core-cladding 2 peaks in Fig. 5(b) to take the IFFTs. The wavelength shifts of each DMI responding to the RIs and temperature variations are demonstrated in Fig. 8, where linear fits of the experimental data are implemented and the RI and temperature sensitivities of the two DMI patterns are (RI unit), and , .
Figure 5.(a) Spatial frequency spectra calculated from Fig. 4(a). (b) Spatial frequency spectra calculated from Fig. 4(b). The insets are the enlarged displays.
Figure 6.Wavelength spectra obtained by taking the IFFT of the selected frequency components in Fig. 4(a) as the RI changes: (a) DMI patterns correspond to core-cladding 1, and (b) DMI patterns correspond to core-cladding 2.
Figure 7.Wavelength spectra obtained by taking the IFFT of the selected frequency components in Fig. 4(b) as the applied temperature changes: (a) DMI patterns correspond to core-cladding 1, and (b) DMI patterns correspond to core-cladding 2.
It is worth noting that the RI of the water varies with the temperature because of the thermo-optic effect, which should be considered when measuring the RIs. So the response of the temperature is the integrative effect of the direct contribution of the temperature change and the indirect contribution of the RI change of the water. According to a previous study[22], the temperature sensitivity of the sensor can be approximately expressed as where and denote the pure sensitivities of the RI and temperature. is the temperature RI coefficient of the water, which has a value of about from Ref. [23]. Thus, the pure temperature sensitivities of the two DMIs can be calculated from Eq. (4) as and when the temperature increases from 20°C to 90°C, respectively. Based on the aforementioned experimental results, Eq. (3) can be rewritten with the achieved RI and temperature sensitivities as follows:
In conclusion, a Fourier analysis applied to the MZI transmission spectrum for the simultaneous measurement of RI and temperature is proposed and experimentally demonstrated. It is the key point of the sensing idea that two different DMI spectra representing different core-cladding interferences with different sensitivities for RI and temperature variations are extracted from the resultant transmission spectrum. The two DMIs are investigated with sensitivities of and , and and . Therefore, the configuration is able to measure the RI and temperature simultaneously. The measuring approach discussed in this Letter can eliminate the influence of multiple interferences and improve the accuracy of the sensor. It can also be utilized with other modal interferometric sensors.
Xu Yan, Haiwei Fu, Huidong Li, Xueguang Qiao, "Simultaneous refractive index and temperature measurements by using dual interference in an all-fiber Mach–Zehnder interferometer," Chin. Opt. Lett. 14, 030603 (2016)