• High Power Laser Science and Engineering
  • Vol. 11, Issue 5, 05000e65 (2023)
Martin Divoky1、*, Jonathan Phillips2, Jan Pilar1, Martin Hanus1, Petr Navratil1, Ondrej Denk1, Tomas Paliesek1, Patricie Severova1, Danielle Clarke2, Martin Smrz1, Thomas Butcher2, Chris Edwards2, John Collier2, and Tomas Mocek1
Author Affiliations
  • 1HiLASE Centre, Institute of Physics of the Czech Academy of Sciences, Dolni Brezany, Czech Republic
  • 2Central Laser Facility, STFC Rutherford Appleton Laboratory, Didcot, UK
  • show less
    DOI: 10.1017/hpl.2023.60 Cite this Article Set citation alerts
    Martin Divoky, Jonathan Phillips, Jan Pilar, Martin Hanus, Petr Navratil, Ondrej Denk, Tomas Paliesek, Patricie Severova, Danielle Clarke, Martin Smrz, Thomas Butcher, Chris Edwards, John Collier, Tomas Mocek. Kilowatt-class high-energy frequency conversion to 95 J at 10 Hz at 515 nm[J]. High Power Laser Science and Engineering, 2023, 11(5): 05000e65 Copy Citation Text show less
    Schematic layout of the conversion experiment. It consists of a laser system and laser beam distribution system (LAS+LBDS), quarter waveplate (QWP), half waveplate (HWP), conversion crystal (LBO), partially reflecting sampling wedge (SW) and beam dump (BD). The diagnostics consist of a dichroic beamsplitter (DBS), mirrors (M), lenses (L), beamsplitters (BS), an energy meter (EM), a near-field camera (C1) and a far field camera (C2). The layout of diagnostic lines is the same for both wavelengths and is shown only once.
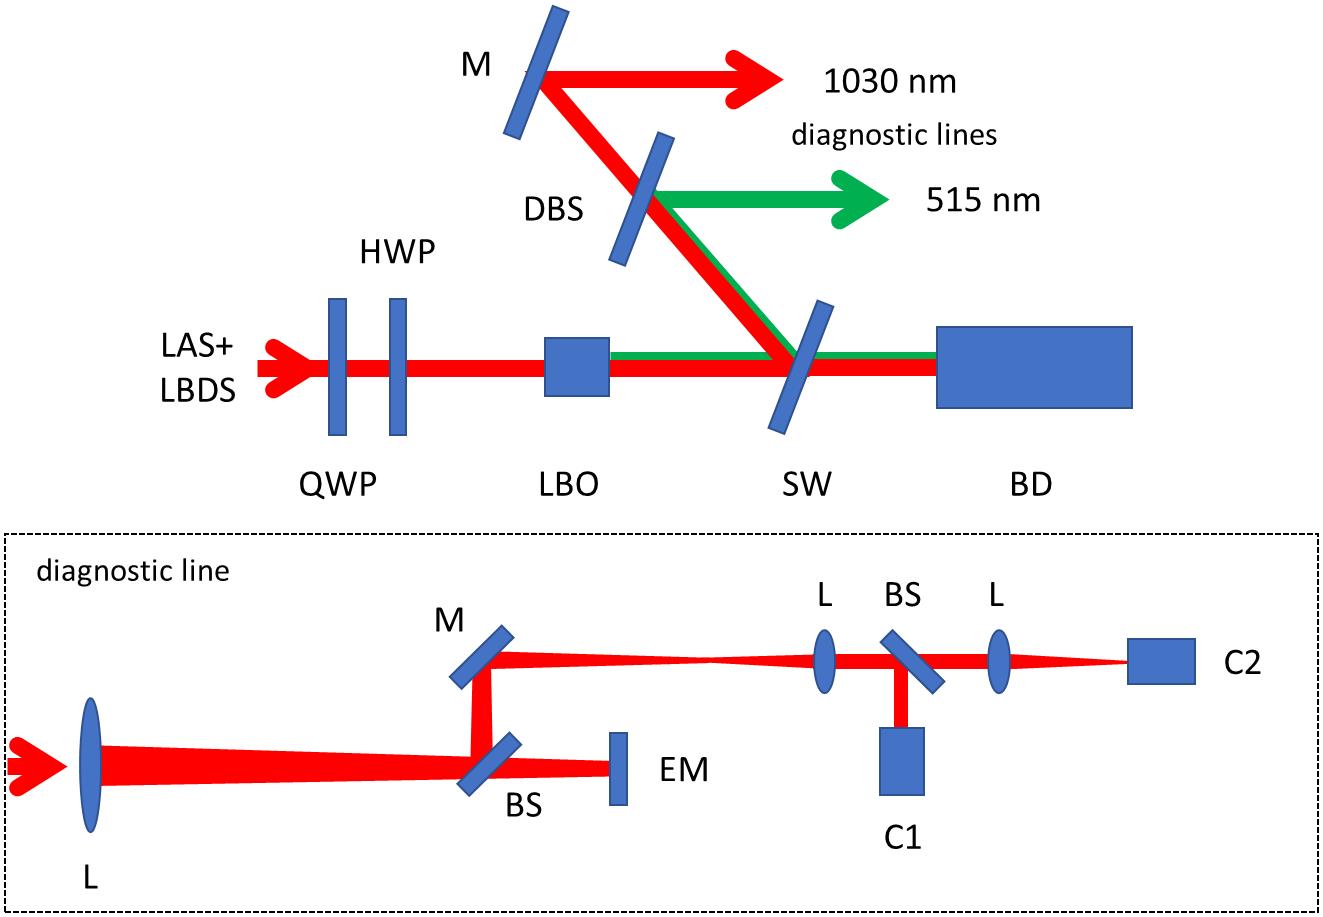
    Fig. 1. Schematic layout of the conversion experiment. It consists of a laser system and laser beam distribution system (LAS+LBDS), quarter waveplate (QWP), half waveplate (HWP), conversion crystal (LBO), partially reflecting sampling wedge (SW) and beam dump (BD). The diagnostics consist of a dichroic beamsplitter (DBS), mirrors (M), lenses (L), beamsplitters (BS), an energy meter (EM), a near-field camera (C1) and a far field camera (C2). The layout of diagnostic lines is the same for both wavelengths and is shown only once.
    Beam profiles after correction waveplates after polarizer transmitting vertical polarization (a), (c), (e), (g) or horizonal polarization (b), (d), (f), (h). (a), (b) Linear polarization entering the power amplifier with no optimization at the output. (c), (d) Optimized polarization at the input. (e), (f) Linear polarization at the input and optimized polarization at the output. (g), (h) Optimized polarization at the input and output. Beam profiles at complementary polarizations were taken under the same conditions and were normalized to the sum of both intensities. The white lines in the pictures correspond to cross-lines through the center of the beam.
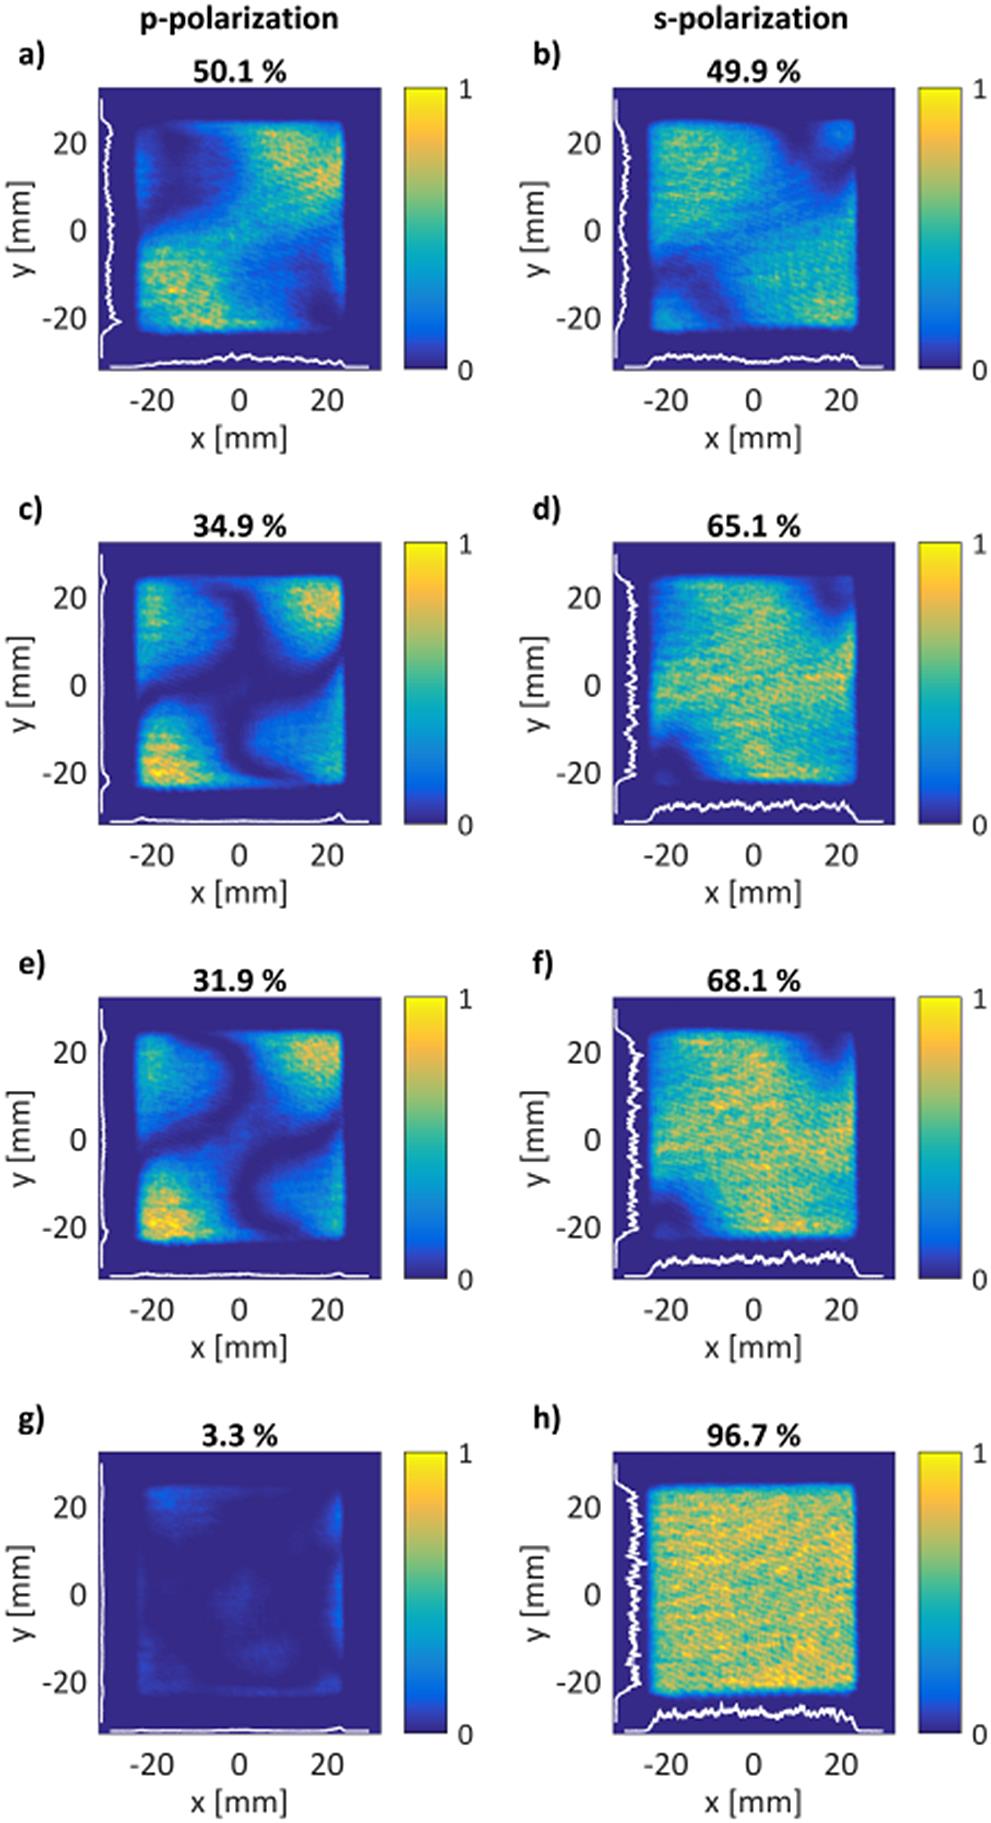
    Fig. 2. Beam profiles after correction waveplates after polarizer transmitting vertical polarization (a), (c), (e), (g) or horizonal polarization (b), (d), (f), (h). (a), (b) Linear polarization entering the power amplifier with no optimization at the output. (c), (d) Optimized polarization at the input. (e), (f) Linear polarization at the input and optimized polarization at the output. (g), (h) Optimized polarization at the input and output. Beam profiles at complementary polarizations were taken under the same conditions and were normalized to the sum of both intensities. The white lines in the pictures correspond to cross-lines through the center of the beam.
    Dependence of the second harmonic frequency output energy and conversion efficiency on the input energy during the energy ramp in the beginning of the experiment.
    Fig. 3. Dependence of the second harmonic frequency output energy and conversion efficiency on the input energy during the energy ramp in the beginning of the experiment.
    Temporal evolution of the energy of the second harmonic frequency and conversion efficiency. Points where the crystal phase matching angle was optimized are marked with arrows.
    Fig. 4. Temporal evolution of the energy of the second harmonic frequency and conversion efficiency. Points where the crystal phase matching angle was optimized are marked with arrows.
    Near-field beam profiles of the input beam at 1030 nm with energy of 121 J and the converted second harmonic frequency (515 nm) beam with energy of 95 J at the repetition rate of 10 Hz.
    Fig. 5. Near-field beam profiles of the input beam at 1030 nm with energy of 121 J and the converted second harmonic frequency (515 nm) beam with energy of 95 J at the repetition rate of 10 Hz.
    Martin Divoky, Jonathan Phillips, Jan Pilar, Martin Hanus, Petr Navratil, Ondrej Denk, Tomas Paliesek, Patricie Severova, Danielle Clarke, Martin Smrz, Thomas Butcher, Chris Edwards, John Collier, Tomas Mocek. Kilowatt-class high-energy frequency conversion to 95 J at 10 Hz at 515 nm[J]. High Power Laser Science and Engineering, 2023, 11(5): 05000e65
    Download Citation