
Jian Zhang, Zhi-Wei Zhang, Wei Ge, Zhen Yuan, "Long-term in vivo monitoring of injury induced brain regeneration of the adult zebrafish by using spectral domain optical coherence tomography," Chin. Opt. Lett. 14, 081702 (2016)
- Chinese Optics Letters
- Vol. 14, Issue 8, 081702 (2016)
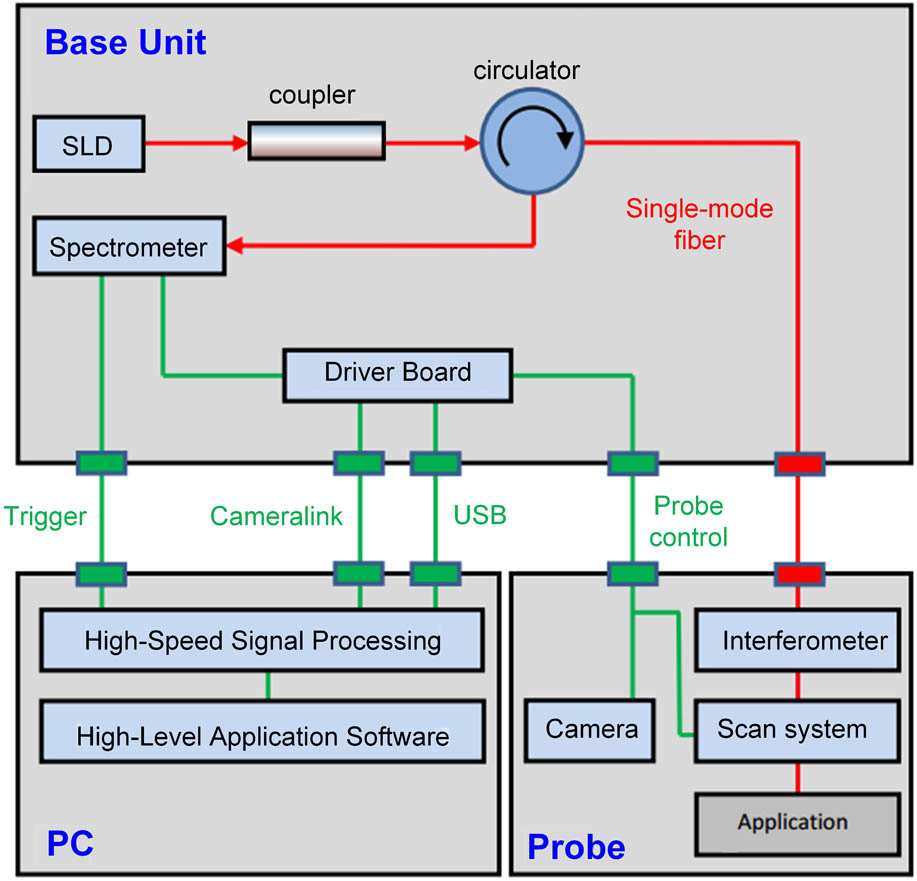
Fig. 1. Schematic of our SD-OCT system for imaging the injured brain of the adult zebrafish.
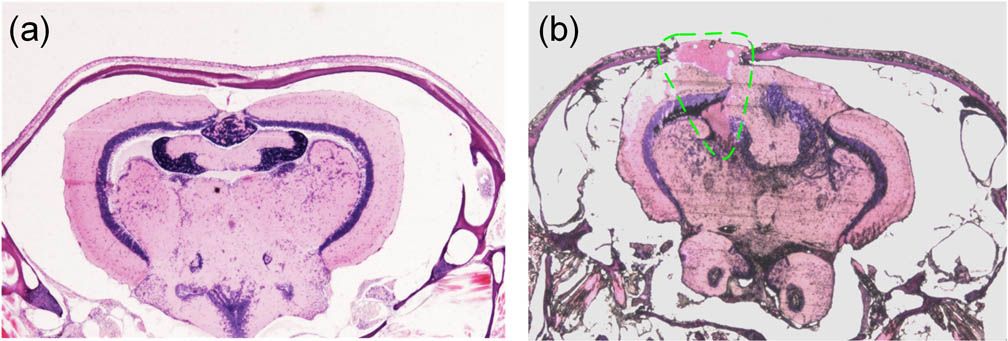
Fig. 2. Histological (H&E) study of adult zebrafish head (a) without or (b) with the needle insertion induced brain injury. Both images were generated using a Nikon microscope under a 2 times objective.
Fig. 3. High-resolution SD-OCT imaging of the needle insertion induced brain injury. (a) Visualization of the needle insertion induced skull injury reconstructed by the 3D SD-OCT. The blue curve denotes the location of the injured regions. (b) The coronal SD-OCT image of the brain along the solid red curve at top right corner across the lesion. The green dash curve denotes the location of the lesion. (c) The sagittal SD-OCT image of the brain lesion along the red line at the top right corner. (d) The sagittal SD-OCT image of the intact brain along the red line at the top right corner. The scale bar is 250 μm.
Fig. 4. Time Serial SD-OCT images show the injured adult zebrafish brain at 0, 10, 20, and 43 days post-lesion. (a) Coronal SD-OCT views of the brain lesion at different time points after the brain injury. (b) Sagittal SD-OCT view of the brain lesion at different time points after the brain injury. The dashed blue curve indicates the injured skull regions, whereas the dashed green curve denotes the approximated boundary of the zebrafish brain.
Fig. 5. 3D characterization of the intact brain as well as the brain tissue regeneration process. (a) The 3D view of the intact adult zebrafish brain (volumetric form, Video 1). (b) The 3D view of the intact adult zebrafish brain (cross-sectional form, Video 2). (c) The cross-sectional 3D view of the brain lesion at 0 days post-lesion (Video 3). (d) The cross-sectional 3D view of the brain lesion at 43 days post-lesion (Video 4).


Set citation alerts for the article
Please enter your email address

© Copyright 2018-2021 | Chinese Laser Press. All Rights Reserved 沪ICP备15018463号-20