
Te Zhu, Xing-Zhong Cao. Research progress of hydrogen/helium effects in metal materials by positron annihilation spectroscopy [J]. Acta Physica Sinica, 2020, 69(17): 177801-1
- Acta Physica Sinica
- Vol. 69, Issue 17, 177801-1 (2020)
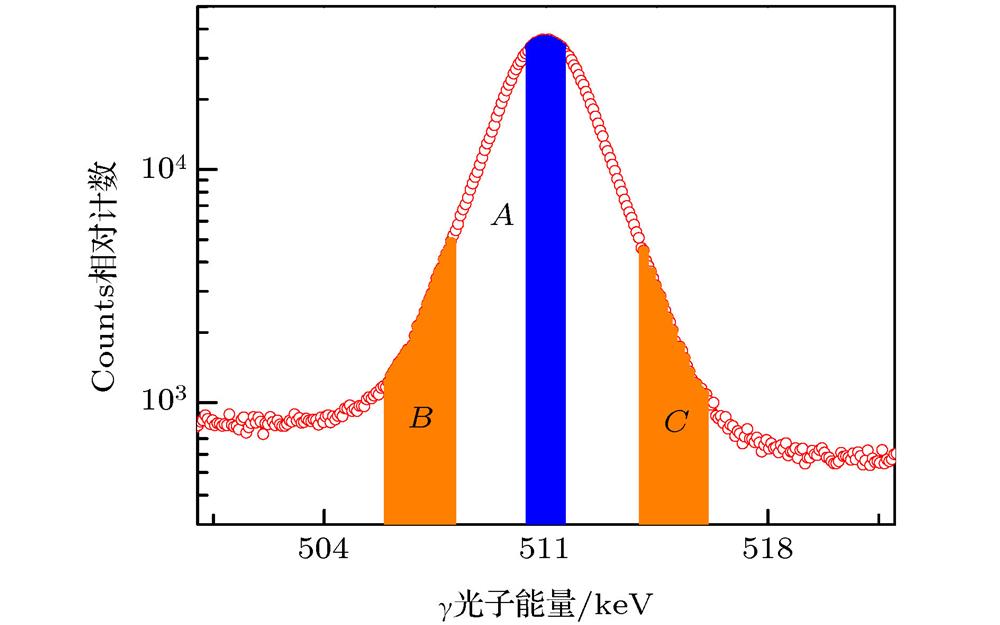
Fig. 1. The parameter definition in the Doppler broadening spectrum.
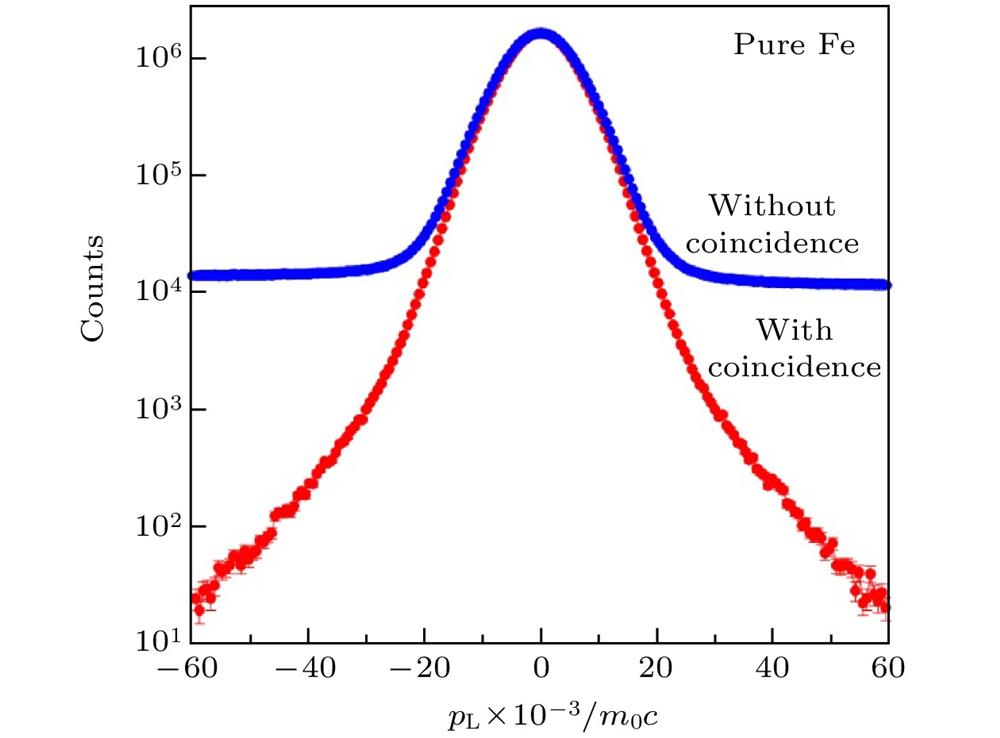
Fig. 2. Peak-to-valley ratio of CDB system in the pure iron.
Fig. 3. Calculated localized wave function of a positron trapped in a mono-vacancy bound with one hydrogen atom in tungsten[26]: (a) Isometric plot; (b) contour plot.
Fig. 4. Calculated positron lifetime in nano-void containing 1 V, 2 V, 6 V, and various H/He atoms[26].
Fig. 5. Profiles of damage and atom concentration in RAFM steel irradiated with 250 keV He2+ and 130 keV H+ calculated with SRIM.
Fig. 6. Fitted S parameters versus VEPFIT for irradiated samples.
Fig. 7. Variation of S parameters versus incident positron energy for He+ irradiated Fe17Cr14.5Ni alloy during isochronal annealing[34].
Fig. 8. Evolution of the S parameters in H-ions irradiated FeCu alloys during isochronal annealing[35].
Fig. 10. S -parameter and ∆S as a function of positron incident energy (mean implantation depth) in irradiated Fe9Cr alloys and for unirradiated specimen[36].
Fig. 11. W -parameter as a function of the S -parameter for irradiated Fe9Cr alloys and for unirradiated one[36].
Fig. 12. Evolution of the S parameters in well-annealed Fe and deformed Fe with He-ions irradiation[39].
Fig. 14. S -parameter (a) and ∆S /S (b) as a function of incident positron energy. ∆S He + ∆S H and ∆S He + H parameter were also shown in (c)[47].
Fig. 15. The S parameter versus depth in the argon-damaged tungsten samples (0/1/6 dpa) with and without deuterium plasma exposure[48].
Fig. 16. (a) The S parameter versus depth in the tungsten samples, and the (S , W ) plots are shown in (b)[49].
Fig. 17. Evolution of S -E curves in deformed 316 L steel exposed to high flux and low energy helium plasma[52].
Fig. 18. Evolution of the W parameters in Fe9Cr alloy with He-ions irradiation.
Fig. 19. CDB ratio curves for the Fe9Cr alloy irradiated with a dose of 1 × 10¹⁵ and 1 × 10¹⁶ He+/cm2[63].
Fig. 20. CDB ratio curves for the Ni irradiated with He-ions (a) and for the Cu irradiated with neutron[66](b).
Fig. 21. CDB ratio curves for the He-ions irradiated 316L samples during isochronal annealing.


Set citation alerts for the article
Please enter your email address

© Copyright 2018-2021 | Chinese Laser Press. All Rights Reserved 沪ICP备15018463号-20