
M. Hess, K. Peterson, A. Harvey-Thompson, "An efficient method for unfolding kinetic pressure driven VISAR data," High Power Laser Sci. Eng. 3, 03000001 (2015)
- High Power Laser Science and Engineering
- Vol. 3, Issue 3, 03000001 (2015)
Abstract
1. Introduction
The general physics of the Velocity Interferometer System for Any Reflector (VISAR)[ is applied to the left-hand side (LHS) of a thin (100–
 ) piece of metal called a VISAR flyer. This pressure results in stress wave propagation through the flyer and, eventually, motion of the right-hand side (RHS) surface of the flyer plate. A laser beam is reflected off the RHS, and the velocity
  of the RHS is inferred by means of an interferometry system. Since the properties of real materials obey an equation of state (EOS), one expects that there will be effects, such as compressibility and time delay (due to wave propagation with finite sound speed), which can play a significant role in determining the velocity of the RHS. By modeling the dynamics of the flyer, one can unfold the measured velocity response and infer the time-dependent pressure drive.
At Sandia National Laboratories, codes such as ALEGRA[ variation in the velocity output compared to the measured velocity. One can then roughly estimate that the uncertainty of the drive pressure is also
  . This follows from the important property that, in the small pressure drive limit,
  , where
  is the initial mass density of the flyer and
  is the material sound speed in the limit of zero pressure and zero temperature, the metal flyer can be modeled elastically, and hence the velocity output is proportional to the pressure. We will illustrate this property in the next section.
The initial guess pressure function is a critical component to the unfold process. Specifically, one often finds that the initial unfold needs to be ‘sufficiently close’ to the final answer in order for the iterative process to actually converge in a timely fashion. By ‘sufficiently close’, we mean that the initial drive candidate should have roughly a similar maximum/minimum magnitude, and a similar shape as a function of time compared to the correct solution. If an auxiliary measurement of the pressure drive exists, then this would often suffice as an initial drive candidate. However, in some experiments it may not be possible to make an auxiliary measurement, in which case it would be necessary to find an alternative method for initializing the unfold process. A specific example of an auxiliary measurement is the use of B-dot probes to measure current through a load[
Sign up for High Power Laser Science and Engineering TOC. Get the latest issue of High Power Laser Science and Engineering delivered right to you!Sign up now
The remainder of this paper describes a technique that we developed for producing the initial guess function for the pressure drive. The method relies on both analytical techniques, as well as implementation of well-known EOS tables, such as the SESAME[ (velocity difference/maximum VISAR velocity) for most of the key components of our datasets. Larger errors,
  , become present due to the difficulty in our method in resolving density variations due to reflections at the VISAR surface, as well as the physics of the release wave in the presence of very strong pressure shocks. Despite these issues, this method has proven to be extremely effective for unfolding kinetic pressure driven VISAR unfolds. One should note that, in practice, a 1% error for a pressure function using an iterative method is often times the best that is achievable. The reason for this is that the unfold process can be extremely nonlinear, i.e. a small change in the pressure drive may lead to a not so small change in VISAR velocity, particularly in the presence of a pressure shock. In certain cases, our method is effective enough to completely avoid employing iterative methods afterwards, and use the initial pressure guess as the unfold itself.
The VISAR unfold method is broken into two parts, which are separately applicable in the ‘low-pressure’ and ‘high-pressure’ regimes. The ‘low-pressure’ part utilizes a many-body coupled harmonic oscillator model for the metal VISAR flyer to predict the VISAR velocity response due to a time-dependent pressure. The ‘high-pressure’ part utilizes realistic EOS tables, such as the SESAME tables, to predict the VISAR response due to the time-dependent velocity. As we shall see, both parts of the method yield excellent VISAR unfold predictions in the different pressure response regimes that can be ‘spliced’ together to form a very accurate VISAR unfold of the pressure.
2. ‘Low-pressure’ coupled harmonic oscillator model
Coupled harmonic oscillator models in solid-state physics are well known, and were initially developed by Einstein[
Suppose that a large metal flyer plate of total mass  and thickness
  is divided into
  equal slices, each of mass
  and with centers spaced a distance
  . We label the center location, velocity and acceleration of the
  slice as
  and
and  , respectively. In our system, the
  slice corresponds to the LHS of the system shown in Figure
  corresponds to the RHS of the system (where the VISAR measurement is made). We assume that the
  slice has a time-dependent force
  being applied to it, and that each slice is interacting with its neighboring slices via a harmonic potential with spring constant
  , or equivalently a characteristic frequency
  . Newton’s laws yield
 (1)
(1)Since we are modeling the internal motion of a continuous solid flyer, we are obviously only interested in the limit that  . It is readily straightforward to reduce this set of equations into one single ordinary differential equation for
  , or equivalently
  , in terms of
  . In the large-
 limit, we let
  , where the subscript ‘RHS’ denotes the RHS of the flyer where the VISAR measurement is made. The final differential equation for
  becomes
 (2)
(2) is a renormalized characteristic frequency. We should note that the authors derived the coefficients for Equation (
 systems, and found that the coefficients approached the values in Equation (
 . Equation (
 (3)
(3) is equal to the velocity at an earlier time
  plus a term that is linearly proportional to the force applied to the LHS at an earlier time
  . In the absence of a viscoelastic strength model, any longitudinal pressure pulse will propagate through the flyer with a sound speed
  , which we assume to be constant. Hence, the renormalized frequency can be written as
  . The total mass can be written as
  and the pressure is
  , where
  is the surface area of the flyer. Equation (
 (4)
(4) is assumed to be constant in the model, both
  and
and  are also assumed to be constant. For real materials that are undergoing a pressure drive, there will always be a change in density and, hence, a change in
  . One can estimate the size of the density perturbation using the above velocity equation and the continuity equation. The density perturbation will be of the order of
  . Additionally, since the speed of sound for real materials is a function of density and temperature, there will also be a change in
  . In order to justify our fixed density and fixed sound speed model, it is sufficient to ensure that the density perturbation is small compared to the initial density when the pressure is zero. This ‘low pressure’ is achieved when the pressure satisfies
  .
.We now show an example in order to illustrate the utility of Equation ( thick aluminum VISAR flyer. In order to demonstrate the effectiveness of Equation (
 and
and  , and material strength effects have been turned off. For aluminum, our ‘low-pressure’ criterion yields
  , and this is satisfied within the simulation in which
  . In Figure
In order to illustrate how the coupled harmonic oscillator model breaks down, suppose that we take an identical pressure drive and multiply it by  , so that the maximum pressure is of the order of 5 GPa, as shown in Figure
  ) for higher-pressure drives and (2) the speed of sound is a function of density. For aluminum, as is true for most solids, the speed of sound increases as the density increases (higher
  ). Both of these effects contribute to a smaller time delay in the velocity response. However, despite the small time shift in the low-velocity regime, one still finds very good agreement between the two results in the low-velocity regime, particularly when the pressure is <1 GPa for aluminum VISAR flyers. The other effect is that the velocity predicted by this model is significantly higher than the ALEGRA simulation result. This effect is due to momentum conservation. In the coupled harmonic oscillator model, the density was assumed to be constant, when in reality the density is increasing under compression. As momentum propagates through the flyer from the LHS to the RHS, a local increase in density would necessarily be accompanied by a local decrease in velocity, which would not be seen in the oscillator model.
For our laser driven blast wave experiments at Sandia, typical pressure drives will have maxima in the 1–10 GPa regime. So we expect that the coupled harmonic oscillator model would give accurate results in regimes corresponding to low pressure (often times in the ‘initial foot’ of the pressure drive), but would need to be modified to incorporate higher-pressure drives.
3. ‘High-pressure’ model
In this section, we show an improved model, which accounts for the changes in thickness of the VISAR flyer, as well as the density dependence of the material sound speed. However, we still limit our discussion to the constant temperature approximation, which in our case corresponds to room temperature at  . For the laser blast wave experiments, ALEGRA simulations indicate that the VISAR flyer temperature (ignoring radiation surface ablation effects) will vary by less than 100 K throughout the spatial extent of the flyer during 100 ns of the laser blast wave. This relatively small change in temperature results in little change of the pressure, as well as the sound speed. This approximation significantly simplifies the unfold model. Although the constant temperature approximation works very well in the pressure drive regime of
  , it is not immediately clear how high a pressure drive is possible before this approximation, and hence the present unfold process, yield significant errors. For large pressures, which can result in significant changes in the flyer temperature, full simulations of the flyer may be required using a code such as ALEGRA.
We make an additional simplification by ignoring the effects of density and pressure reflections in the system. The main drawback of this approximation is that it limits the length of time over which the unfold can be applied, since reflections that make it back to the LHS can affect the density along with the external pressure. If one knows approximately the characteristic time of the pressure response, then the VISAR flyer can be made sufficiently thick so as to reduce the effect of the reflections. Despite this additional assumption, we find that it still offers a useful unfold that is highly relevant for our experimental data.
The model utilizes mass and momentum conservation, as well as pressure boundary conditions applied at the LHS and RHS. In order to capture the correct physics of the density dependence of the sound speed within the flyer, it is necessary to incorporate well-known EOS tables, such as the SESAME tables. These tables provide material pressure as a function of density and temperature, i.e.  , as well as the energy per mass
  , from which the sound speed can also be found
  . However, because we are only considering a fixed temperature model at
  , our model uses constant temperature curves for pressure and sound speed at
  , i.e.,
  and
and  .
.
Assume that the external pressure drive on the LHS is given by  . Since the pressure is continuous across the material surface then one immediately obtains the density on the LHS, namely
 (5)
(5) (6)
(6) is starting from 0 at
  , and can be divided into small pressure steps of value,
  , where
  , etc. at time locations
  . As the number of steps increases to infinity, we can model a continuous pressure drive. When the pressure is increased from
  to
to  , the density of the LHS increases from its initial density
  to
to  . A shock front propagates from the LHS to the RHS moving at a speed
  . All material in front of the shock is at a density
  , and material behind the shock is at a density
  moving with a new speed
  . The amount of momentum per area externally imparted on the material is
  , and the total momentum per area of the material is
  . Hence momentum conservation yields
  (7)
(7) and
and  , when the pressure has changed to
  , one finds that the LHS density is
  . Again, momentum conservation yields the new speed of the LHS
 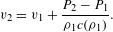 (8)
(8) steps, we find
  (9)
(9) and
and  , and one finds that
  (10)
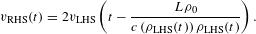
(10)The next important component of this unfold is determining the time-delay factor, i.e. the time for a pressure drive at the LHS to be received at the RHS. Suppose that at time  the density of the LHS due to the pressure drive is
  . We know that this pressure signal will propagate with a speed
  through the VISAR flyer. However, since the density has been increased from the initial density
  (accordingly the thickness has decreased from the original thickness of
  ), the propagation distance has decreased, leading to a reduction in the time delay. The total time-delay factor for the signal to reach the RHS starting from the LHS is
  .
.
Since there is no pressure being applied to the RHS, the density of the RHS must stay fixed at  for all time. The material velocity of the signal is given by
  . Since the signal is reflected at the RHS boundary with the density held constant, the velocity of the RHS must be twice that of the incoming velocity. The velocity response of the RHS or VISAR measurement due to the time-dependent pressure drive with appropriate time-delay factor is given by
 (11)
(11) (12)
(12) . For each time
  , the integral in Equation (
 and, hence, the
  that produces the RHS VISAR velocity. This provides the correct time-shift factor for
  as shown in the integrand of Equation (
 .
.As an aside, it is worth noting that in the limit of small pressure, Equation ( and
and  (constant sound speed), so that Equation (
 (13)
(13)4. Implementation of the unfold process
In this section, we show how we can use both the ‘high-pressure’ model in Equation ( approaches zero for a given EOS table. This property is readily connected to the fact that the sound speed has a discontinuous derivative as
  approaches zero. However, since the low-pressure regime can be resolved using Equation (
 and the associated pressure cutoff to be 0.7 GPa provides excellent results.
We illustrate this unfold process using actual data from a series of experiments, which investigated the properties of the laser blast wave found in the Sandia MagLIF experiment. In these experiments, a  thick aluminum tube with an initial radius of 2.8 mm contains a
  gas fill at 57 psi. A 2 kJ laser pulse from the Sandia Z-Beamlet[
Figure  ) at axial locations 3.59 mm, 5.71 mm and 7.84 mm below the laser entrance hole (LEH) respectively. For pressures below 0.7 GPa, the oscillator model in Equation (
 data points, we find that there is a subset of data points in which the time shift may be too great, giving rise to a
  which is multivalued in certain sections. As part of our method, we filter out data points later in the
  list that would give rise to a multivalued behavior. Typically, this behavior occurs near strong shocking events, such as near the pressure peak at 30 ns in Figure
Using the unfolded pressure drives in Figure
References
[1] L. M. Barker, R. E. Hollenbach. J. Appl. Phys., 43, 4669(1972).
[2] D. E. Grady. Mech. Mater., 29, 181(1998).
[3] R. W. Lemke, M. D. Knudson, J.-P. Davis. Intl J. Impact Eng., 38, 480(2011).
[4] A. C. Robinson, T. Brunner, S. Carroll, R. Drake, C. Garasi, T. Gardiner, T. Haill, H. Hanshaw, D. Hensinger, D. Labreche, R. Lemke, E. Love, C. Luchini, S. Mosso, J. Niederhaus, C. Ober, S. Petney, W. Rider, G. Scovazzi, O. Strack, R. Summers, T. Trucano, V. Weirs, M. Wong, T. Voth, 15204(2008).
[6] G. B. Zimmermann, W. L. Kruer. Co. Plasma Phys. Control. Fusion, 2, 51(1975).
[7] M. R. Martin, R. W. Lemke, R. D. McBride, J. P. Davis, D. H. Dolan, M. D. Knudson, K. R. Cochrane, D. B. Sinars, I. C. Smith, M. Savage, W. A. Stygar, K. Killebrew, D. G. Flicker, M. C. Herrmann. Phys. Plasmas, 19(2012).
[10] D. Hayes.
[11] K. S. Holian.
[12] A. Einstein. Ann. Phys., Lpz., 22, 180(1907).
[13] P. Debye. Ann. Phys., Lpz., 39, 789(1912).
[14] E. Gruneisen. Zustand des festen Körpers, 1(1926).
[15] D. Sinars.
[16] M. P. Desjarlais. Contrib. Plasma Phys., 41, 267(2001).
[18] D. C. Rovang, D. C. Lamppa, M. E. Cuneo, A. C. Owen, J. McKenney, D. W. Johnson, S. Radovich, R. J. Kaye, R. D. McBride, C. S. Alexander, T. J. Awe, S. A. Slutz, A. B. Sefkow, T. A. Haill, P. A. Jones, J. W. Argo, D. G. Dalton, G. K. Robertson, E. M. Waisman, D. B. Sinars, J. Meissner, M. Milhous, D. N. Nguyen, C. H. Mielke. Rev. Sci. Instrum., 8(2014).
[19] B. M. Adams, W. J. Bohnhoff, K. R. Dalbey, J. P. Eddy, M. S. Eldred, D. M. Gay, K. Haskell, P. D. Hough, L. P. Swiler.


Set citation alerts for the article
Please enter your email address

© Copyright 2018-2021 | Chinese Laser Press. All Rights Reserved 沪ICP备15018463号-20