• Acta Physica Sinica
  • Vol. 69, Issue 17, 174202-1 (2020)
Yin-Juan Ge1、2、3, Xing-Chen Pan1、2、*, Cheng Liu1、2, and Jian-Qiang Zhu1、2、*
Author Affiliations
  • 1Key Laboratory of High Power Laser and Physics, Shanghai Institute of Optics and Fine Mechanics, Chinese Academy of Sciences, Shanghai 201800, China
  • 2National Laboratory on High Power Laser and Physics, Chinese Academy of Sciences and China Academy of Engineering Physics, Shanghai 201800, China
  • 3School of Physical Science and Technology, ShanghaiTech University, Shanghai 201210, China
  • show less
    DOI: 10.7498/aps.69.20200224 Cite this Article
    Yin-Juan Ge, Xing-Chen Pan, Cheng Liu, Jian-Qiang Zhu. Technique of detecting optical components based on coherent modulation imaging[J]. Acta Physica Sinica, 2020, 69(17): 174202-1 Copy Citation Text show less
    (a) Basic scheme for the measurement of optical components using CMI; (b) photo of the experimental setup; (c) amplitude and (d) phase of the center part of the random phase plate reconstructed by ePIE. The scale bar of (c) is 0.198 mm.
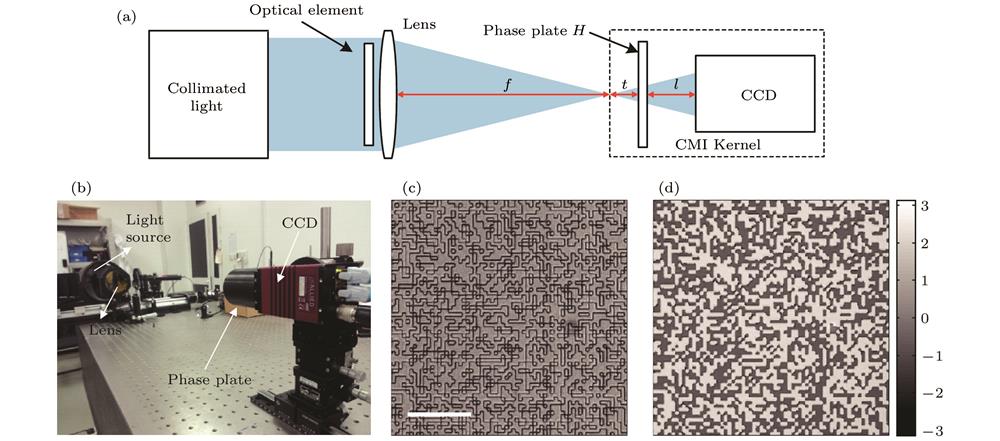
    Fig. 1. (a) Basic scheme for the measurement of optical components using CMI; (b) photo of the experimental setup; (c) amplitude and (d) phase of the center part of the random phase plate reconstructed by ePIE. The scale bar of (c) is 0.198 mm.
    Flowchart of iterative process.
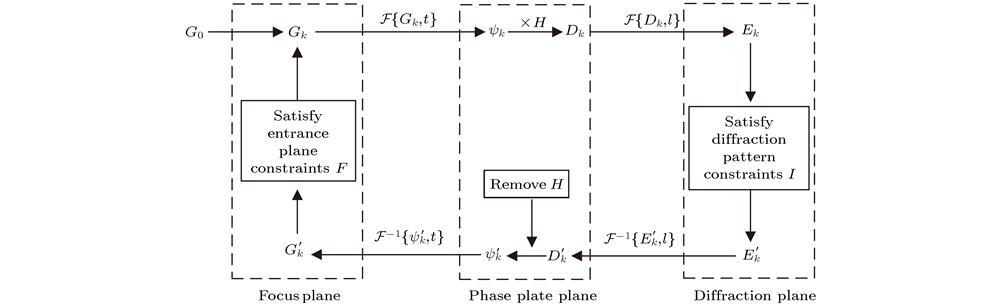
    Fig. 2. Flowchart of iterative process.
    (a) Photo of the plate glasses used in experiments; (b) diffraction pattern recorded by CCD; (c) phase map of plate glass obtained directly by phase subtraction. The section marked by the black dashed circle with a diameter of 79.1 mm is used for the analysis of PV and RMS. The constant phase slope is not removed for these calculations.
    Fig. 3. (a) Photo of the plate glasses used in experiments; (b) diffraction pattern recorded by CCD; (c) phase map of plate glass obtained directly by phase subtraction. The section marked by the black dashed circle with a diameter of 79.1 mm is used for the analysis of PV and RMS. The constant phase slope is not removed for these calculations.
    Least-squares linear regressions of PV (a) and RMS (b) comparing the measurements from the CMI and Zygo interferometer.
    Fig. 4. Least-squares linear regressions of PV (a) and RMS (b) comparing the measurements from the CMI and Zygo interferometer.
    Phase maps of ten different plate glasses measured by CMI and inteferometer.
    Fig. 5. Phase maps of ten different plate glasses measured by CMI and inteferometer.
    (a) Photograph of an optical flat with PV = λ/20; phase maps of the optical flat, measured by the Zygo interferometer (b) and (c) by CMI. λ = 632.8 nm.
    Fig. 6. (a) Photograph of an optical flat with PV = λ/20; phase maps of the optical flat, measured by the Zygo interferometer (b) and (c) by CMI. λ = 632.8 nm.
    No.${\overline {{\rm{PV}}} _{{\rm{CMI}}}}$${S_{{\rm{pv}}}}$${\rm{P}}{{\rm{V}}_{{\rm{Zygo}}}}$${\overline {{\rm{RMS}}} _{{\rm{CMI}}}}$${S_{{\rm{RMS}}}}$${\rm{RM}}{{\rm{S}}_{{\rm{Zygo}}}}$
    10.1782.40 × 10–30.1480.0546.40 × 10–40.042
    20.1181.20 × 10–30.1690.0284.60 × 10–40.021
    30.1802.40 × 103 0.1790.0384.80 × 10–40.030
    40.1596.90 × 10–40.2060.0232.20 × 10–40.025
    50.2601.50 × 10–30.2210.0753.00 × 10–40.068
    60.2542.30 × 10–30.2430.0745.90 × 10–40.072
    70.2783.30 × 10–30.2520.0717.60 × 10–40.061
    80.3312.10 × 10–30.3580.0995.50 × 10–40.099
    90.4332.60 × 10–30.4000.1148.10 × 10–40.102
    100.4752.10 × 10–30.4450.1383.90 × 10–40.124
    Table 1.

    CMI and interferometer results (λ).

    CMI和干涉仪的测量结果(λ)

    Yin-Juan Ge, Xing-Chen Pan, Cheng Liu, Jian-Qiang Zhu. Technique of detecting optical components based on coherent modulation imaging[J]. Acta Physica Sinica, 2020, 69(17): 174202-1
    Download Citation