
Cheng Zhang, Jin Wang, Guoguo Kang, Jianxin Gao, Zhier Qu, Shuai Wan, Chunhua Dong, Yijie Pan, Jifeng Qu, "Soliton microcomb-assisted microring photonic thermometer with ultra-high resolution and broad range," Photonics Res. 11, A44 (2023)
- Photonics Research
- Vol. 11, Issue 10, A44 (2023)
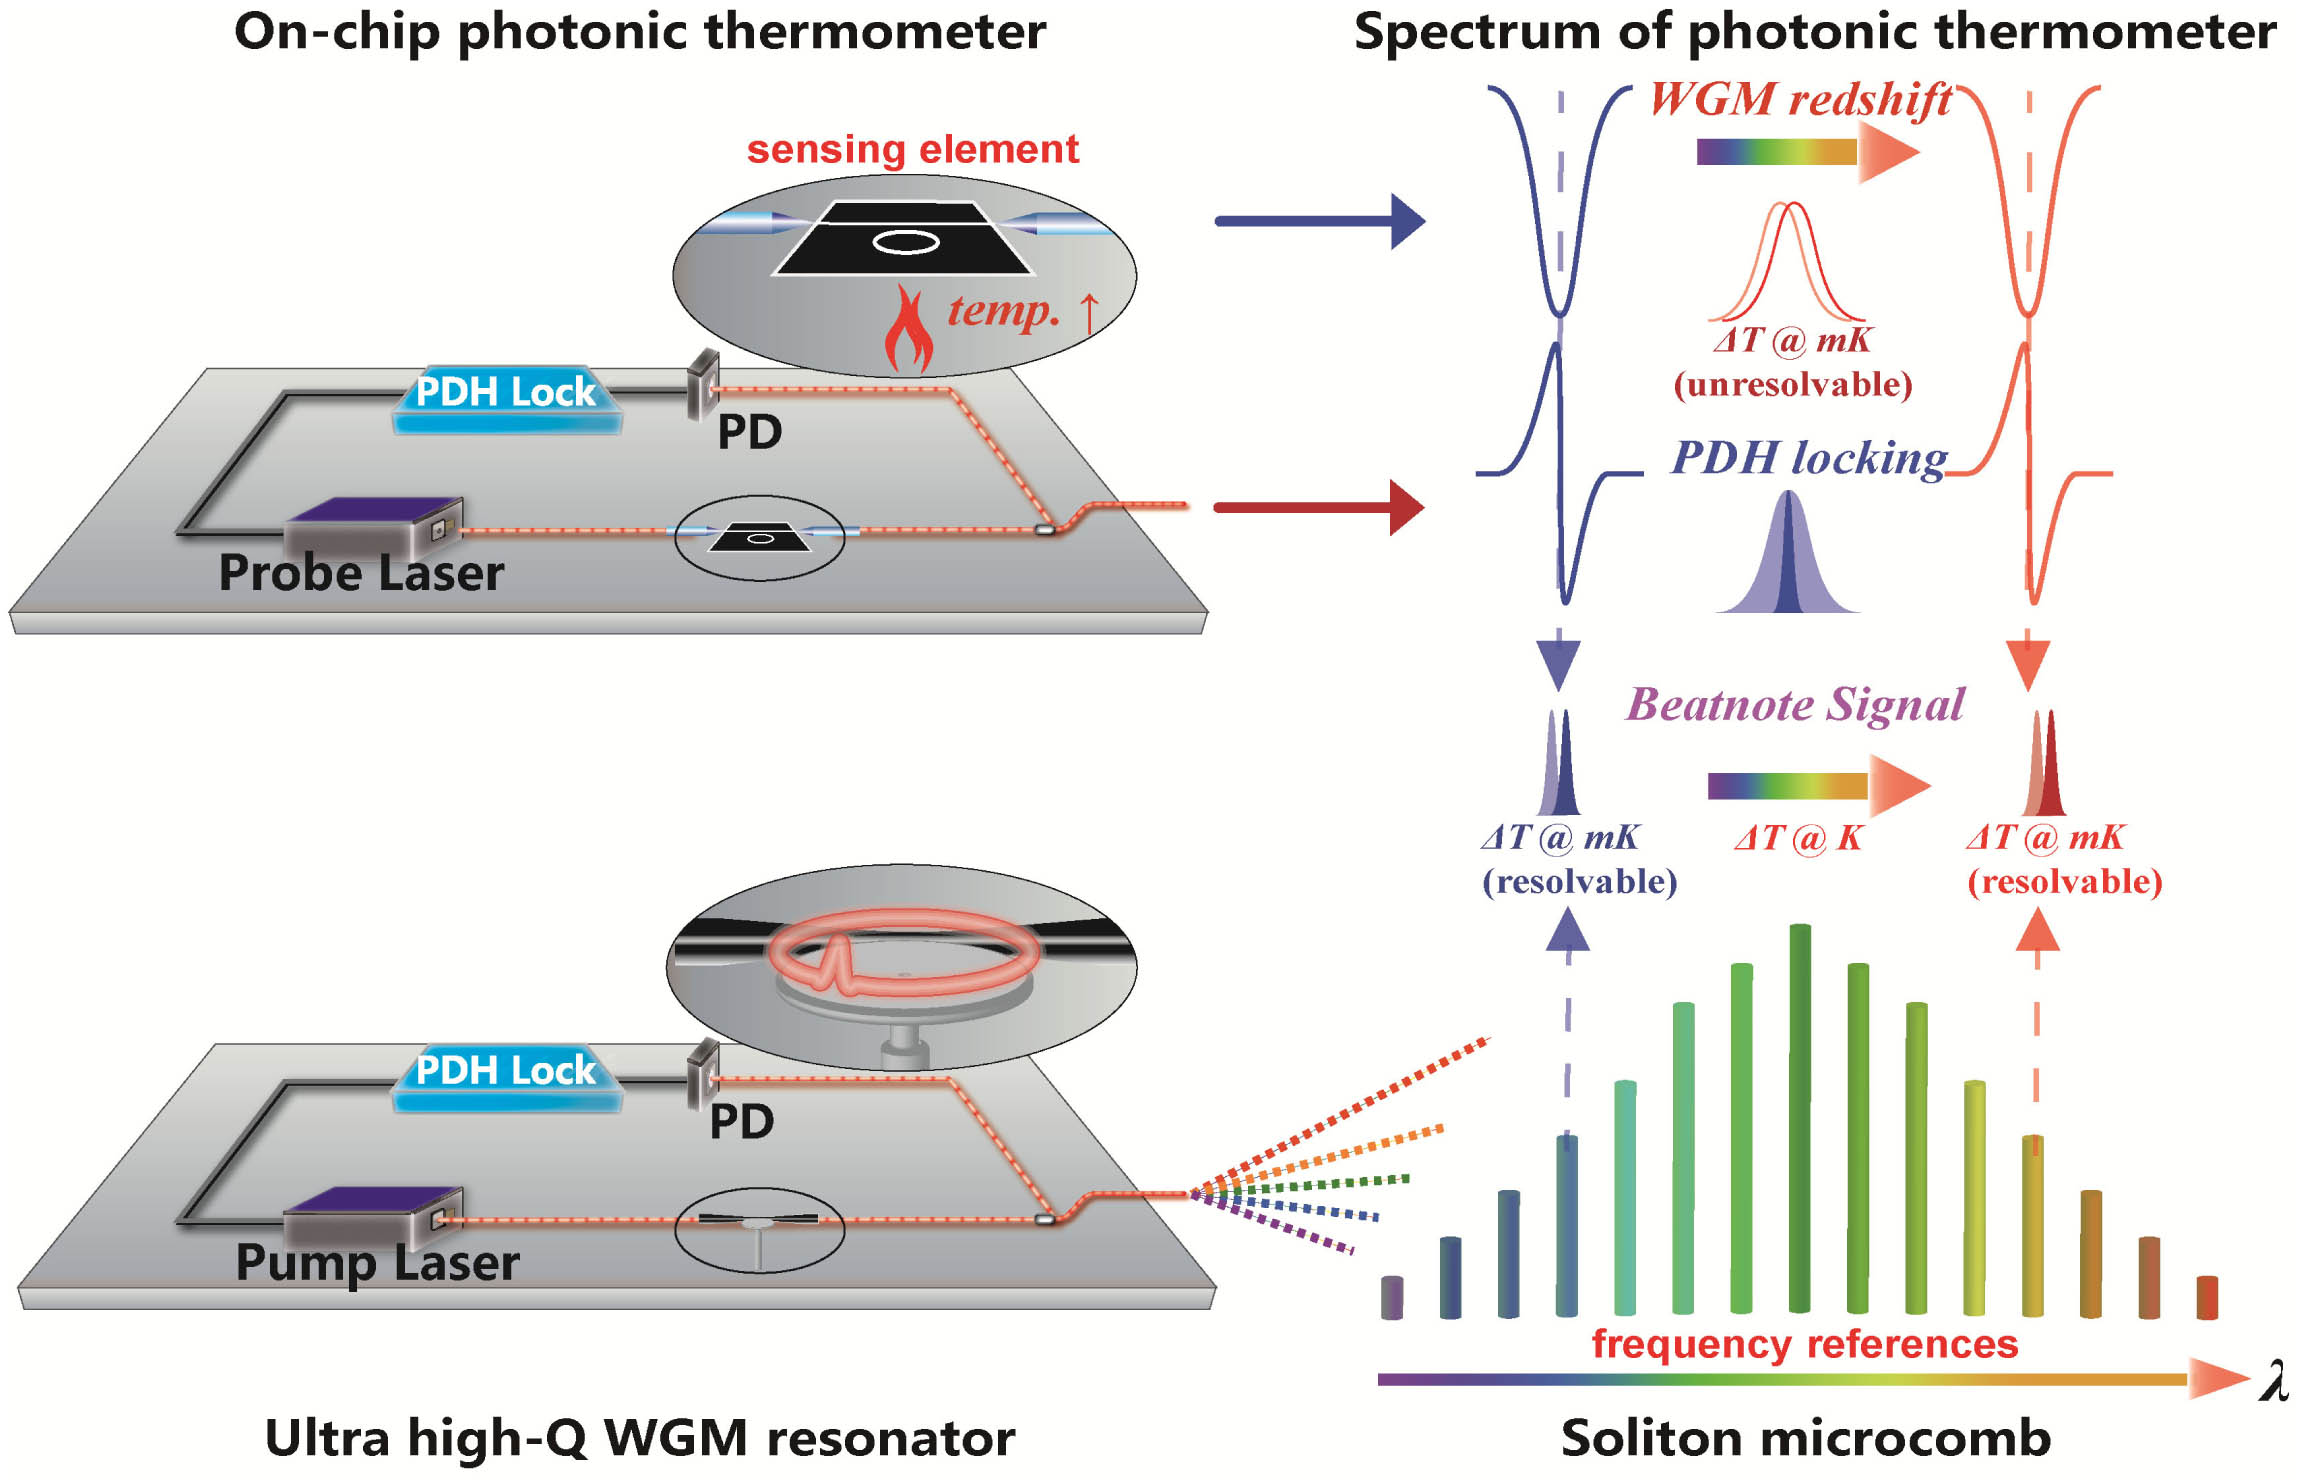
Fig. 1. Concept of the microcomb-assisted ultra-high-resolution and broad-range WGM photonic thermometer. The sensing element is an on-chip microring WGMR, which generates WGM red shift with increasing temperature (positive thermo-optic coefficient). The PDH locking ensures linewidth reduction and tracking of the WGM. The soliton microcomb provides broadband frequency references, thereby ensuring a broad range. By combining PDH-locking microring with a soliton microcomb, the temperature sensing achieves ultra-high resolution and broad range.
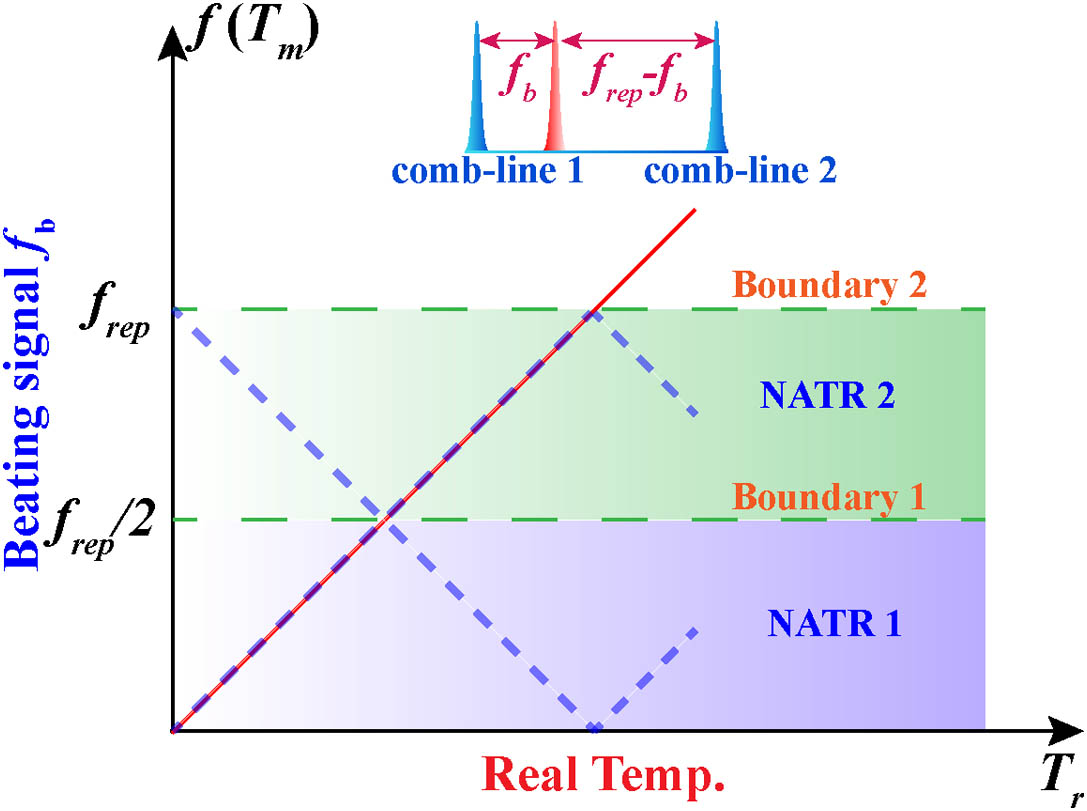
Fig. 2. Beatnote ambiguity during microcomb-assisted temperature sensing. The blue dashed line, red solid line, and green dashed line are the beatnote signals, real temperature curve, and non-ambiguous temperature range (NATR) boundary, respectively.
Fig. 3. (a) SEM image of fabricated Si 3 N 4 MgF 2 Si 3 N 4
Fig. 4. (a) Optical spectrum of single-soliton microcomb; (b) electrical spectrum of MC-WGM beatnote signal.
Fig. 5. (a) Measured waterfall spectrum shows signal ambiguity near the NATR boundary (white dash line); (b) measured voltage gradient of the feedback signal for ambiguity resolving process; (c) reconstructed temperature curve (blue solid line) and reference temperature curve (red solid line).
Fig. 6. (a) Measured temperature curve shows ultra-high resolution in a broad temperature range, and the temperature deviation curve reflects the heat transfer rate, proving our proposed sensor has a fast response (temp. deviation = meas. temp.−
Fig. 7. (a) Transmission spectra of two different soliton locking regimes; (b) repetition frequency stability and corresponding temperature stability of two different soliton locking regimes; (c) pump frequency stability and corresponding temperature stability of two different soliton locking regimes.
|
Table 1. Comparison of Chip-Scale Photonic Thermometer Performance


Set citation alerts for the article
Please enter your email address

© Copyright 2018-2021 | Chinese Laser Press. All Rights Reserved 沪ICP备15018463号-20