Author Affiliations
1Business School of Jishou University, Jishou 416000, Hunan China2Jishou University Academician Workstation, Institute of Geographic Sciences and Natural Resources Research, CAS, Jishou 416000, Hunan China3School of Economics and Management, Changsha University of Science and Technology, Changsha 410000, China4School of Accounting, Hunan University of Technology and Business, Changsha 410205, China5Academy of Great Bay Area Studies, Guangzhou 510070, Chinashow less
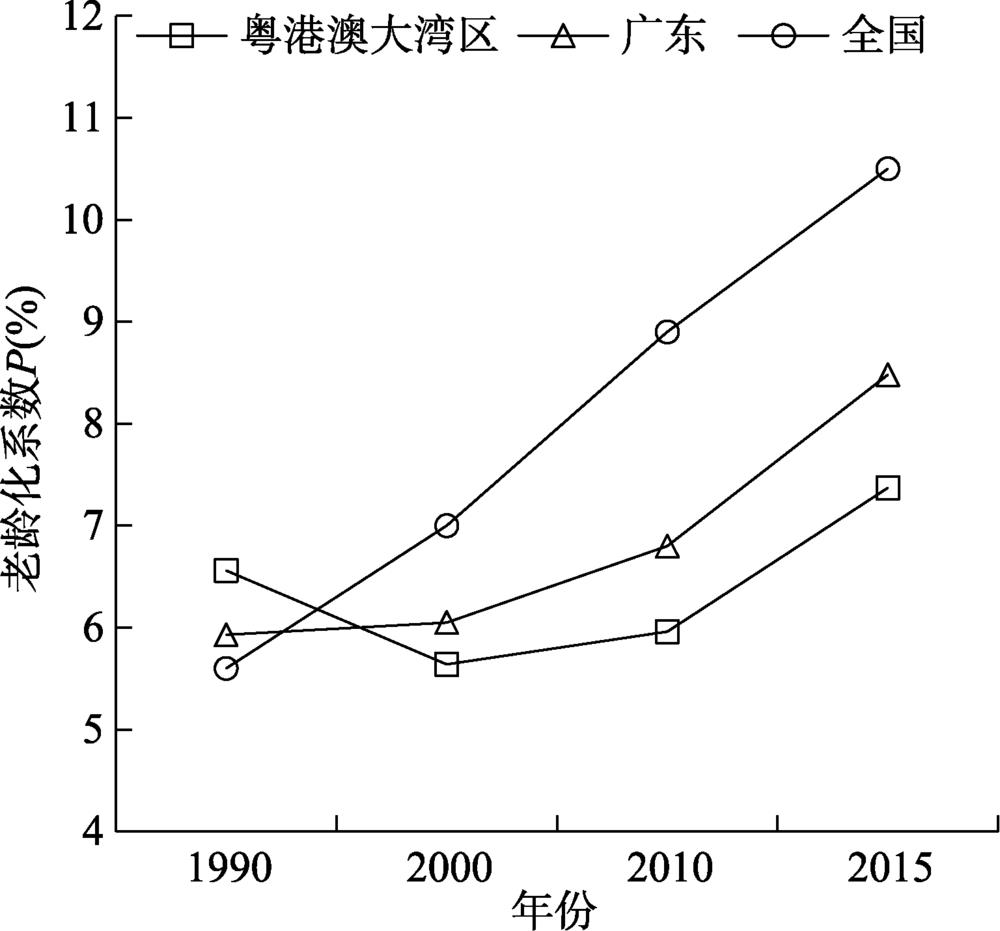
Fig. 1. Population aging trends in the Guangdong-Hong Kong-Macao Greater Bay Area, Guangdong Province, and China from 1990 to 2015
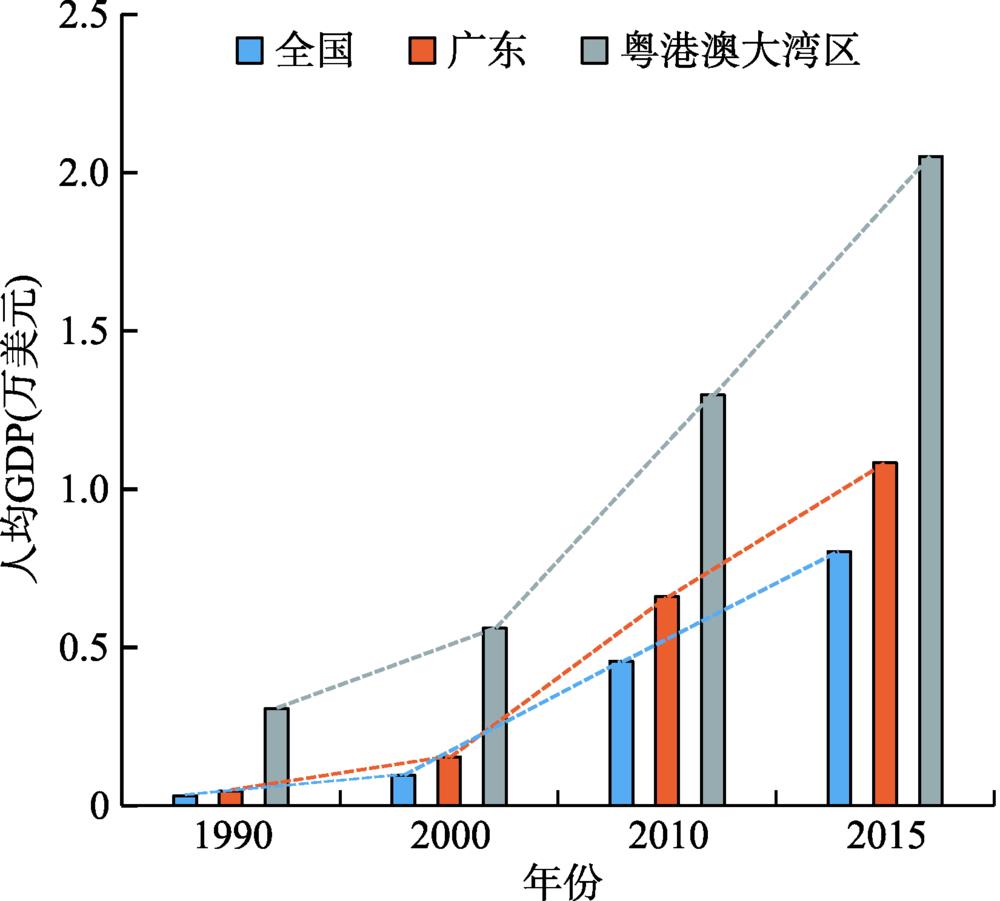
Fig. 2. Per capita GDP trend of the Guangdong-Hong Kong-Macao Greater Bay Area from 1990 to 2015
Fig. 3. Evolution of the spatial pattern of aging coefficients in the Guangdong-Hong Kong-Macao Greater Bay Area in 1990, 2000, 2010 and 2015
Fig. 4. Evolution of the spatial pattern of per capita GDP in the Guangdong-Hong Kong-Macao Greater Bay Area in 1990, 2000, 2010 and 2015
Fig. 5. LISA clustering chart of per capita GDP of the Guangdong-Hong Kong-Macao Greater Bay Area in 2015
| 老龄化系数(P) | 人口结构类型 | 老龄化系数(P) | 人口结构类型 |
|---|
| P < 4.0 | 年轻型 | 7~10 | 老年型I期 | | 4.0~5.5 | 成年型I期 | 10~14 | 老年型II期 | | 5.5~7.0 | 成年型II期 | P≥14.0 | 老年型III期 |
|
Table 1. Aging coefficient and population age structure (%)
| 1990年 | 2000年 | 2010年 | 2015年 |
|---|
| 深圳 | 年轻型 | 年轻型 | 年轻型 | 年轻型 | | 东莞 | 成年型I期 | 年轻型 | 年轻型 | 年轻型 | | 惠州 | 成年型II期 | 成年型II期 | 成年型II期 | 成年型II期 | | 中山 | 成年型II期 | 成年型I期 | 成年型I期 | 成年型II期 | | 佛山 | 成年型II期 | 成年型I期 | 成年型I期 | 成年型II期 | | 珠海 | 成年型I期 | 成年型I期 | 成年型I期 | 成年型II期 | | 广州 | 成年型II期 | 成年型II期 | 成年型II期 | 老年型I期 | | 肇庆 | 成年型II期 | 老年型I期 | 老年型I期 | 老年型II期 | | 澳门 | 成年型II期 | 老年型I期 | 老年型I期 | 老年型I期 | | 江门 | 老年型I期 | 老年型I期 | 老年型I期 | 老年型II期 | | 香港 | 老年型I期 | 老年型II期 | 老年型II期 | 老年型III期 | | 区域平均 | 成年型II期 | 成年型II期 | 成年型II期 | 老年型I期 | | 全国 | 成年型II期 | 老年型I期 | 老年型I期 | 老年型II期 |
|
Table 2. Evolution of population age structure in the Guangdong-Hong Kong-Macao Greater Bay Area from 1990 to 2015
| 地区 | 1990年 | | 2000年 | | 2010年 | | 2015年 |
|---|
| 人均GDP | 老龄化系数 | 人均GDP | 老龄化系数 | 人均GDP | 老龄化系数 | 人均GDP | 老龄化系数 |
|---|
| 广州 | 1038 | 6.30 | | 3095 | 6.10 | | 12918 | 6.67 | | 21860 | 7.92 | | 佛山 | 869 | 6.77 | 2443 | 5.25 | 11863 | 5.25 | 17383 | 6.79 | | 肇庆 | 325 | 6.23 | 896 | 7.86 | 4134 | 9.08 | 7812 | 10.2 | | 深圳 | 1321 | 2.22 | 3961 | 1.23 | 13929 | 1.79 | 25359 | 2.90 | | 东莞 | 950 | 4.99 | 1652 | 2.09 | 7799 | 2.29 | 12137 | 3.74 | | 惠州 | 418 | 5.94 | 1676 | 6.23 | 5709 | 5.91 | 10631 | 6.55 | | 珠海 | 1057 | 4.62 | 3354 | 4.03 | 11505 | 5.01 | 20026 | 6.64 | | 中山 | 733 | 6.28 | 1821 | 4.62 | 8980 | 4.43 | 15093 | 5.73 | | 江门 | 509 | 7.94 | 1552 | 8.66 | 5262 | 9.08 | 7963 | 11.39 | | 香港 | 13110 | 8.46 | 25319 | 10.94 | 32550 | 13.08 | 42430 | 15.29 | | 澳门 | 10041 | 6.59 | 14879 | 7.08 | 52650 | 7.38 | 70795 | 8.98 | | 区域平均 | 3070 | 6.56 | 5609 | 5.64 | 12980 | 5.96 | 20509 | 7.37 |
|
Table 3. [in Chinese]
| Moran’s I | E(I) | SD | Z值 | P值 |
|---|
| 0.2681 | -0.0233 | 0.1045 | 2.7832 | 0.0170 |
|
Table 4. Moran ’s I test results of the global per capita GDP of the Guangdong-Hong Kong-Macao Greater Bay Area
| 被解释变量:ln Y |
|---|
| Variable | OLS | SEM | SAR | | Constant | -11.4904***(1.93) | -13.4848***(1.45) | -11.1651***(1.81) | | p | -0.0343**(0.02) | -0.0291**(0.01) | -0.0284*(0.02) | | ln K | 0.5694***(0.10) | 0.5799***(0.08) | 0.5519***(0.10) | | ln L | 1.5501***(0.18) | 1.7165***(0.13) | 1.3829***(0.20) | | Rho | — | — | 0.1468(1.17) | | Lambda | — | -0.5047**(0.20) | — | | Adj-R-squared | 0.7955 | — | — | | AIC | 23.7043 | 19.9447 | 24.6494 | | SC | 30.8411 | 27.0815 | 33.5703 | | Log likelihood | -7.8522 | -5.9723 | -7.3247 |
|
Table 5. Regression results of the impact of population aging on economic growth in the Guangdong-Hong Kong-Macao Greater Bay Area
| 被解释变量:ln Y |
|---|
| Variable | 经济距离权重 | | 地理距离权重 | | SEM | SAR | SEM | SAR | | Constant | -15.7945***(2.46) | -10.7587***(1.66) | | -11.4904***(1.90) | -22.2587***(2.03) | | p | -0.0449***(0.01) | -0.0459***(0.01) | -0.0343**(0.02) | -0.0350**(0.02) | | lnK | 0.5545***(0.08) | 0.548***(0.08) | 0.5694***(0.10) | 0.5815***(0.09) | | lnL | 1.5381***(0.15) | 1.5185***(0.15) | 1.5501***(0.17) | 1.5828***(0.17) | | Rho | — | -0.3146***(0.10) | — | 0.9091***(0.06) | | Lambda | -0.3006***(0.10) | — | 1.1000***(0.07) | — | | Adj-R-squared | — | — | — | — | | AIC | 18.7555 | 18.8029 | 22.2710 | 24.2710 | | SC | 29.4607 | 29.5080 | 29.4077 | 33.1919 | | Log likelihood | -3.3778 | -3.4015 | -7.1355 | -7.1355 |
|
Table 6. Model regression results under economic distance weight matrix and geographical distance weight matrix
| 年份 | 老龄化系数(%) | 类型 | 人均GDP(美元) | 年份 | 老龄化系数(%) | 类型 | 人均GDP(美元) |
|---|
| 1990 | 8.46 | 老年型I期 | 13110 | 2005 | 12.25 | 老年型II期 | 26093 | | 1991 | 8.73 | 老年型I期 | 14955 | 2006 | 12.43 | 老年型II期 | 27697 | | 1992 | 9.00 | 老年型I期 | 17356 | 2007 | 12.61 | 老年型II期 | 29902 | | 1993 | 9.25 | 老年型I期 | 19659 | 2008 | 12.69 | 老年型II期 | 30871 | | 1994 | 9.51 | 老年型I期 | 21673 | 2009 | 12.89 | 老年型II期 | 30696 | | 1995 | 9.78 | 老年型I期 | 22765 | 2010 | 13.08 | 老年型II期 | 32550 | | 1996 | 10.12 | 老年型II期 | 24702 | 2011 | 13.31 | 老年型II期 | 35142 | | 1997 | 10.42 | 老年型II期 | 27169 | 2012 | 13.70 | 老年型II期 | 36732 | | 1998 | 10.66 | 老年型II期 | 25507 | 2013 | 14.27 | 老年型III期 | 38403 | | 1999 | 10.93 | 老年型II期 | 24713 | 2014 | 14.71 | 老年型III期 | 40315 | | 2000 | 10.94 | 老年型II期 | 25319 | 2015 | 15.29 | 老年型III期 | 42430 | | 2001 | 11.22 | 老年型II期 | 24771 | 2016 | 15.85 | 老年型III期 | 43735 | | 2002 | 11.52 | 老年型II期 | 24120 | 2017 | 16.43 | 老年型III期 | 46221 | | 2003 | 11.82 | 老年型II期 | 23293 | 2018 | 16.99 | 老年型III期 | 48672 | | 2004 | 12.07 | 老年型II期 | 24454 | | | | |
|
Table 7. Evolution of the age structure of Hong Kong's population from 1990 to 2018
| 变量 | ADF检验 | 各显著性水平的临界值 |
|---|
| 0.01 | 0.05 | 0.10 |
|---|
| lnY | -2.4939 | -4.6679 | -3.7332 | -3.3103 | | D(lnY) | -3.4700 | -3.9591 | -3.0810 | -2.6813 | | lnK | -2.6971 | -4.8000 | -3.7912 | -3.3423 | | D(lnK) | -7.6940 | -4.8000 | -3.7912 | -3.3423 | | lnL | -1.9862 | -4.6679 | -3.7332 | -3.3103 | | D(lnL) | -4.0244 | -3.9591 | -3.0810 | -2.6813 | | O | -2.1373 | -4.6679 | -3.7332 | -3.3103 | | D(O) | -2.8201 | -4.7283 | -3.7597 | -3.3249 | | D(D(O)) | -5.3735 | -4.0044 | -3.0989 | -2.6904 |
|
Table 8. ADF unit root test
| 假设条件 | Eigenvalue | Trace Statistic | 5% Crititical Value | Prob. |
|---|
| None | 0.9827 | 99.2744 | 47.8561 | 0.0000 | | At most 1 | 0.9094 | 42.4794 | 29.7971 | 0.0011 | | At most 2 | 0.3907 | 8.8550 | 15.4947 | 0.3790 |
|
Table 9. Johansen cointegration test results
| Variable | Coefficient | Std.Error | t-statistic | Prob. |
|---|
| Constant | -27.3322 | 4.7933 | -5.7022 | 0.0001 | | lnL | 2.4437 | 0.4038 | 6.0521 | 0.0001 | | D(p) | -0.4053 | 0.1842 | -2.2004 | 0.0481 | | lnK | 1.0160 | 0.1315 | 7.7271 | 0.0000 | | R-squared | 0.9010 | Mean dependent var | 12.3441 | | Adjusted R-squared | 0.8763 | S.D. dependent var | 0.1869 | | S.E. of regression | 0.0657 | Akaike info criterion | -2.3937 | | Sum squared resid | 0.0519 | Schwarz criterion | -2.2005 | | Log likelihood | 23.1496 | Hannan-Quinn criter. | -2.3838 | | F-statistic | 36.4117 | Durbin-Watson stat | 2.0637 | | Prob(F-statistic) | 0.0000 | | | | Sample(adjusted):1997:2012 | | | |
|
Table 10. regression results of the impact of population aging on economy