
Younghwan Yang, Trevon Badloe, Junsuk Rho, "Writing nanometer-scale structures for centimeter-scale color printing," Adv. Photon. 5, 030501 (2023)
- Advanced Photonics
- Vol. 5, Issue 3, 030501 (2023)
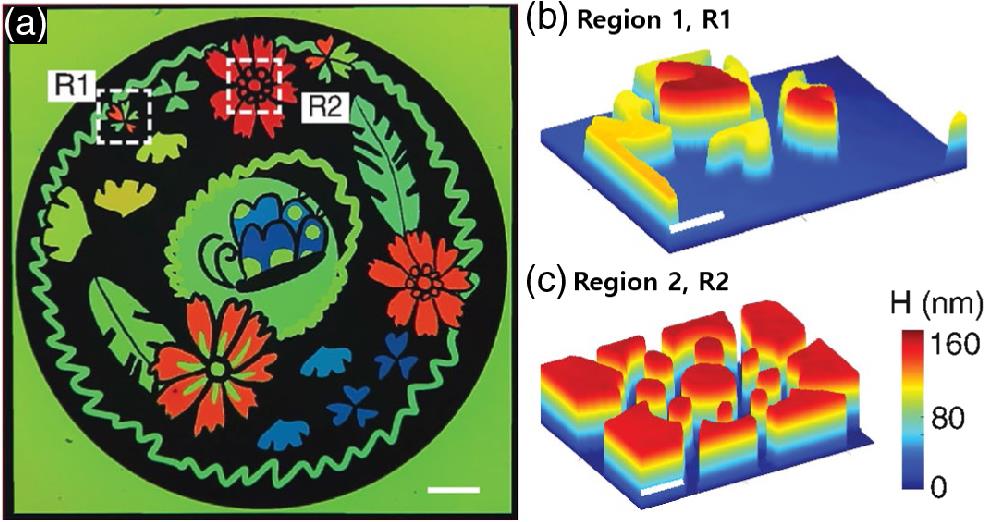
Fig. 1. Demonstration of centimeter-scale structural coloration. (a) A captured image under a halogen lamp. Scale bar: 1 mm. (b) and (c) are the thickness scanning images of region 1 (R1) and region 2 (R2), respectively, using a light interferometer. Scale bars:


Set citation alerts for the article
Please enter your email address

© Copyright 2018-2021 | Chinese Laser Press. All Rights Reserved 沪ICP备15018463号-20