Rodrigo G. dos Santos, Lauro J. Q. Maia, Cid B. de Araújo, Leonardo de S. Menezes. Nonlinear optical characterization of single -barium-borate nanocrystals using second-harmonic confocal microscopy[J]. Chinese Optics Letters, 2018, 16(4): 041902
Copy Citation Text
The confocal microscopy technique was applied for nonlinear optical characterization of single -barium-borate (-BBO) nanocrystals. The experimental setup allows measurements of the laser polarization-selective second-harmonic (SH) generation, and the results can be used to determine the nanocrystals’ -axis orientation, as well as to obtain information about their second-order susceptibility . The dependence of the SH signal on the laser polarization allowed the discrimination of individual particles from aggregates. The data were fitted using a model that takes into account the BBO properties and the experimental setup characteristics considering (i) the electrostatic approximation, (ii) the effects of the microscope objective used to focus the light on the sample in an epi-geometry configuration, and (iii) the symmetry of for the -BBO nanocrystals. A signal at the third-harmonic frequency was also detected, but it was too weak to be studied in detail.
Confocal microscopy (CM) is a well-known technique for biological applications that is able to generate high-resolution (HR) images of micrometric structures with a high signal-to-noise ratio[1,2]. The large resolution is attributed to a spatial filter, which allows only the sample’s portions in the perifocal region to be detected. CM is ideal for studying biological systems, such as membranes, tissues, and cells[3,4]. On the other hand, usual microscopy (i.e., performed without the spatial filter) can be significantly improved if the imaging process is nonlinear (NL). Optical conversion by NL processes to the ultraviolet (UV) range can also have therapeutic applications, since DNA UV absorption can lead to photodamage and eventually apoptosis[5].
When the structures of interest themselves are not able to generate an appreciable NL signal, NL imaging labels can be used. The so-called second-harmonic (SH) radiating imaging probes (SHRIMPs) are of special interest for NL microscopy because they combine an infrared laser source, which has a greater penetration depth in biological tissues, being especially promising for in vivo applications, and a shorter emission wavelength, thus increasing the intrinsic resolution of the apparatus and allowing pinholeless optical sectioning[6,7]. In principle, SHRIMPs can be tuned in a large spectral range because their sizes are much smaller than the coherence length, although for longer wavelengths, the multiple harmonics are easier to be detected. Moreover, most SHRIMPs have a good transmittance in the visible and near-infrared, due to the wide band-gap and do not suffer the effects of photobleaching or emission intermittency, due to the SH generation (SHG) nature[8,9].
Beta-barium borate, (-BBO), is a NL optical material transparent from , being a good candidate for SHRIMP applications[10,11]. For uniaxial crystals like -BBO, which has a trigonal point group of 3 m [space group R3c (161)], only two angles, as usually defined in spherical coordinates, are required to determine the -axis orientation, (polar angle), and (azymuthal angle), with the incident wave propagating along the Z axis and being linearly polarized in the XY plane with a polarization angle relative to the X axis. Due to this geometry, the -BBO nanocrystals (NCs) are symmetric by the operation , as well as by any rotation along the -axis.
Sign up for Chinese Optics Letters TOC. Get the latest issue of Chinese Optics Letters delivered right to you!Sign up now
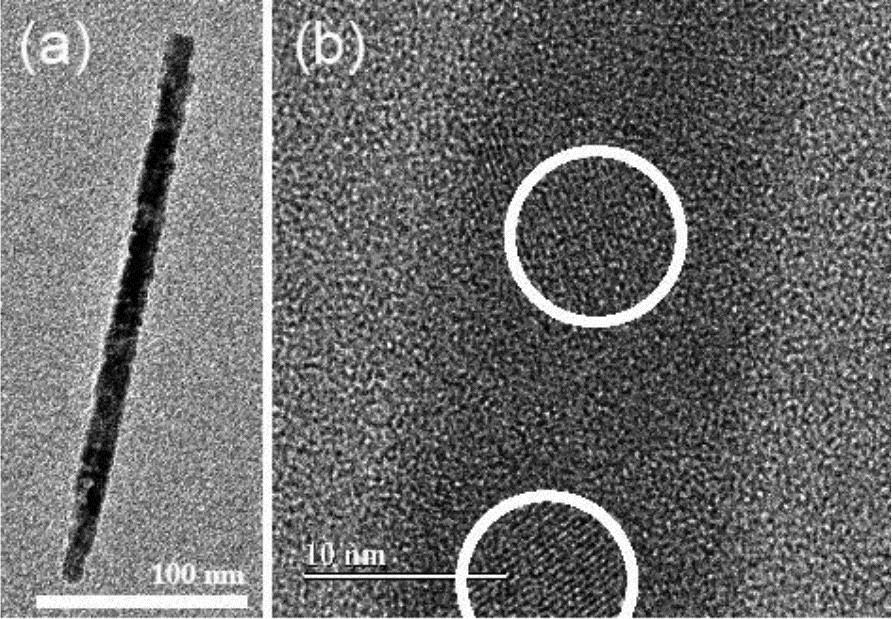
The studied samples were synthesized and characterized as described in Refs. [12,13]. X-ray diffraction at the Bragg–Brentano configuration revealed the exclusive presence of the non-centrosymmetric crystalline phase. Transmission electronic microscopy (TEM), high-resolution TEM (HR-TEM), and selected area electron diffraction (SAED) images of a typical sample from the same batch as those used during the herein reported experiments revealed that the -BBO particles are shaped as parallelepipedic needles, as shown in Fig. 1(a). Size distribution histograms show that the average needles’ dimensions were , although crystals as long as 1 μm were observed. This is a result of the crystals’ growth process along the c-axis, which makes one dimension much larger than the other two. Additionally, the SAED images show that the needles are polycrystalline. This can also be verified in the HR-TEM images, in which interference fringes of nanocrystallites about 17 nm in diameter can be seen inside single needles, as shown in Fig. 1(b).
Figure 1.(a) TEM image of a typical needle-shaped -BBO NC (scale ). (b) HR-TEM image of an individual needle showing two nanocrystallites, marked by round curves (scale ).
These nanocrystallites are monocrystals, in which the borate-group rings do not present rotation along the c-axis, but a defect can occur during the growth process: a rotation of a ring with respect to the others. However, since rotations along the symmetry axis do not affect the SHG, the polycrystalline needles behave effectively as monocrystalline regardless of possible defects of this type. In the samples studied with SHG microscopy, this result was confirmed by images acquired with a scanning electron microscope.
In epi-geometry CM, the light scattered by the sample can be collected through the same objective used to focus the excitation light beam. A conveniently chosen beamsplitter ensures that only the wavelengths of interest are sent via transmission to an aperture and the light detector. The confocal character of the microscope is determined by this aperture. The final image will be given by the point spread function (PSF) of the apparatus, which is defined as the image amplitude at the detector plane when the lens is illuminated by a perfect point light source.
The PSF is a function of several variables: not only the spatial coordinates, but also the microscope’s parameters, such as the numerical aperture (NA), incident wavelength, and, in case of oil immersion objectives, the oil’s refractive index. Therefore, it is useful to introduce normalized optical coordinates (OCs), thus optimizing computer calculations. There are actually two units: one axial () along the optical axis of the objective and one radial () along the detector plane. Both units can be defined as[1]where is the refractive index of the medium between the objective and the sample, is the incident wavelength, is the cone angle, and M is the total microscope’s magnification. and are ordinary lengths. In NL optics experiments, the images are formed coherently due to parametric nature of the optical conversion. In the SHG case, the image amplitudes at the focal plane are given by[14]where is the OC defined in Eq. (2).
Equation (3) represents the ideal PSF for CM with an infinitesimal pinhole. The pinhole’s size for the lateral resolution is introduced by a piecewise function[15,16]. For all imaging processes, there is a certain pinhole size for which the resolution is optimized. An improper choice of pinhole size can lead to a resolution smaller than that obtained by conventional microscopes.
Considering the limiting case, in which the pinhole radius () is zero, the confocal resolution is larger than the conventional by a factor of . Below 0.5OC, the resolution is not substantially increased, and it is almost invariant with the pinhole size. However, it is more critical for NL optical imaging, since for OC, the resolution quickly shifts to the conventional one. From these considerations of the SHG imaging theory, a pinhole diameter of 10 μm was found to be suitable for the experiments performed in this work. For our experimental setup, the radial resolution from Eq. (3) is found to be about 140 nm for an infinitesimal pinhole and 200 nm for the pinholeless configuration. The longer NCs are useful for the experiment because at that size the PSF is small enough to produce sharper images.
To study the SHG in single -BBO NCs, the electric field of the incident excitation laser at the fundamental frequency is decomposed into three orthogonal components in the NC reference frame (RF): where X, Y, and Z are coordinates defined in the laboratory RF, and , , and are unit vectors in the NC RF. Since -BBO is a uniaxial crystal, only two angles are required to describe the orientation with respect to the laboratory frame. Considering an incident wave in the XY plane, the c-axis is rotated about the Z axis by and about the X axis by [17,18]. Applying a proper rotation matrix and considering the electrostatic approximation, one can determine the NC -axis orientation by recording the response of the SHG to the laser polarization, which can be adjusted to be along the X axis in the laboratory RF. The polarization response of single NCs as small as hundreds of nanometers long can be recorded by means of the CM technique, since under tight focusing conditions and with a sufficiently diluted sample, ensemble averages and interactions between particles are avoided.
The experimental setup was as follows: a mode-locked Ti:sapphire laser (120 fs, 76 MHz) was set at 820 nm and directed to a telescope in order to compensate the laser beam divergence. At the telescope’s focal position, a chopper was installed to modulate the laser intensity. The laser beam passed through a half-wave plate (HWP) and a polarizer to control the excitation beam energy. The beam then passed through a second HWP (HWP2) installed on a rotatory mount and was used for polarization resolved measurements. At this point, the choice of the laser wavelength at 820 nm becomes evident: the dichroic mirror available for this experiment had an optimal reflection for wavelengths larger than 810 nm and a good transmission around 410 nm, being suitable for reflecting the laser beam and transmitting the SH signal from the sample.
After entering a homemade inverted microscope, the laser (maximum average power: 280 mW) was focused by a 100× objective () on the sample: a spin-coated diluted dispersion of -BBO NCs in isopropanol on a cover glass, which was set on top of the objective. After the nanoparticle was placed in the confocal spot, the SH signal (plus the fundamental frequency) traveled back through the same objective and was transmitted by the dichroic mirror, shining on another telescope at which a focal point at a 10 μm pinhole was installed. After that, the signal was sent to a photomultiplier coupled to a monochromator for filtering out residues of scattered light at the fundamental wavelength and measuring the SH spectrum. The signal generated by the photomultiplier was sent to a lock-in amplifier with output connected to a digital oscilloscope. In order to perform raster scans, the sample was moved along three orthogonal directions by a piezo module connected to an open-loop piezo controller. The whole communication was set by using a homemade software.
The SH signal-to-noise ratio was large enough to perform the sample’s characterization. On the other hand, the third-harmonic signal was barely detected even after several attempts of optimization. This was due to several factors, such as the shorter emission wavelength (), which requires customized optical components and a sensitive detector at this wavelength to record the signal, the sample absorbance at the UV spectral range, and the signal intensity itself, which was expected to be about one order-of-magnitude weaker than the SH. Therefore, the following discussion will be limited to the SH.
The NC SH image was formed by scanning the sample using a sawtooth pattern across an area of in 50 nm increments. Figures 2(a) and 2(b) show two different particles of similar dimensions. Notice that the image’s width gets smaller once the pinhole is inserted in the detection path, and the improved lateral resolution originates sharper images.
Figure 2.Raster scan images. (a) Single emitter recorded without using a spatial filter; (b) CM (10 μm pinhole).
Figure 3(a) shows the SH spectrum for a single NC peaked at 409.5 nm with a full width at half-maximum (FWHM) of 2.6 nm. With a signal-to-noise ratio of about 1000:1, a quite good fit was possible for the power dependence, and the system could handle the pinhole without completely loosing the signal. The slope of the line in Fig. 3(b) corroborates the quadratic dependence of the SH signal on the laser intensity.
Figure 3.(a) Spectrum of the observed SH emission (inset: spectrum of the excitation laser). (b) SH signal dependence on the excitation laser average power.
The spectral distribution for harmonic generation can be expressed as[19]where is the harmonic order, is the fundamental FWHM, and is the FWHM for the th-order harmonic. For SHG, one has a narrowing factor of . Thus, for a FWHM of 6.7 nm at 820 nm central wavelength, the FWHM of the SH pulses generated at 410 nm should therefore be , which is in accordance with the experimental results.
After locating a single NC by detecting the SH signal performing raster scanning, the SHG dependence on the excitation laser polarization direction was recorded. By rotating the incident laser polarization by 180° in steps of 10° and recording the SH signal intensity, it was possible to draw polar graphs, as shown in Fig. 4. The narrow widths of the -shaped curves indicate that the SH is due to individual NCs. For NC clusters, besides the SH signal being larger than for single NCs, the polar graphs are more isotropic. The lines in Fig. 4 are fits made by closely following the procedure described in Refs. [17,18], explicitly using equations of Ref. [18]: the NCs’ -axis orientation angles are determined by fitting the polarization response to a specific model for -BBO NCs. The model predicts a polarization signature for each pair of angles, and, therefore, knowing the shape of the curve, the -axis orientation can be identified. In this adjustment procedure, the NCs’ -axis orientation angles are the fit parameters. It is worth noticing that, due to their morphology, the majority of the NCs’ c-axes are oriented around . Since the power irradiated by a -BBO NC is strongly dependent on the angle between its c-axis and the excitation laser polarization direction, when the NCs are located at the laser focal spot, only the ones oriented in such a way that the polarization curve gives a sufficiently large signal can be detected. The maximum intensity is obtained when the laser polarization is perpendicular to the NC’s c-axis. This is typical for 3m crystals, as shown in Ref. [6]. The -axis orientation angles for the four single NCs represented in Fig. 4 are specified for each one in the caption.
Figure 4.Polarization response characterized by (, ) for some single nanoparticles (approximated lengths: 800 nm). From (a) to (d) the NC’s -axis orientations are (78°, 76°), (87°, 88°), (73°, 87°), and (79°, 64°). The straight lines represent the directions of the NC’s c-axis.
It is expected that such NCs by their nature and typical sizes still behave as optically bulky materials. Therefore, to determine the value of of such NCs, the following procedure was adopted. (i) The NC’s length was estimated based on the PSF deconvolution. The NC’s volume was used to find the radius of an equivalent sphere, [in the case of the particle shown in Fig. 2(b), the equivalent sphere radius is 38 nm]. (ii) The laser parameters as well as the overall losses due to collection, transmission of optical components and detection were taken into account, leading to total losses of . (iii) The SH scattering cross-section could be calculated[6], so that where and are the optical powers at the SH and fundamental frequencies, respectively. For the NC represented in Fig. 2(b), was found to be . Since (with , the dominant NL coefficient in BBO)[20], one gets , thus with the same order-of-magnitude as the result obtained in this work. As mentioned before, this is expected given the typical sizes of the studied NCs. A more precise measurement of is limited by how accurate the estimation/measurement of the NC dimensions is and the losses in the setup.
In conclusion, -BBO NCs were synthesized, and their basic characterization was performed. An experimental scanning probe CM setup for performing NL microscopy was built, and it was possible to detect SH from single -BBO NCs with a large signal-to-noise ratio. The effect of the pinhole installed in the detection path on the system PSF was investigated. By performing polarization dependent SHG measurements, it was possible to find the orientation of the NCs’ c-axis. The results allowed for the determination of the modulus of effective second-order susceptibility of single -BBO NCs, being of the same order-of-magnitude of that from bulk -BBO. It was also possible to detect a weak third-harmonic signal from the NCs, although the setup was far from being optimized for that measurement.
References
[1] T. R. Corle, G. S. Kino. Confocal Scanning Optical Microscopy and Related Imaging Systems(1996).
Rodrigo G. dos Santos, Lauro J. Q. Maia, Cid B. de Araújo, Leonardo de S. Menezes. Nonlinear optical characterization of single -barium-borate nanocrystals using second-harmonic confocal microscopy[J]. Chinese Optics Letters, 2018, 16(4): 041902