• Chinese Optics Letters
  • Vol. 18, Issue 4, 042603 (2020)
Sung-Man Kim* and Hanbit Park
Author Affiliations
  • Department of Electronic Engineering, Kyungsung University, Nam-Gu, Busan 48434, South Korea
  • show less
    DOI: 10.3788/COL202018.042603 Cite this Article Set citation alerts
    Sung-Man Kim, Hanbit Park. Optimization of optical wireless power transfer using near-infrared laser diodes[J]. Chinese Optics Letters, 2020, 18(4): 042603 Copy Citation Text show less
    Classification of current wireless power transfer technologies.
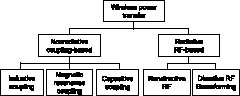
    Fig. 1. Classification of current wireless power transfer technologies.
    General block diagram of the OWPT.
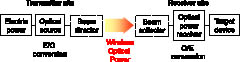
    Fig. 2. General block diagram of the OWPT.
    Block diagram and picture of the experimental setup.
    Fig. 3. Block diagram and picture of the experimental setup.
    E/O conversion efficiency and optical output power of (a) a 200 mW LD and (b) a 500 mW LD.
    Fig. 4. E/O conversion efficiency and optical output power of (a) a 200 mW LD and (b) a 500 mW LD.
    Voltage-current graphs of the (a) PV cell and (b) PD by changing the load resistance when the 200 mW LD is operating at the maximum E/O conversion condition.
    Fig. 5. Voltage-current graphs of the (a) PV cell and (b) PD by changing the load resistance when the 200 mW LD is operating at the maximum E/O conversion condition.
    Voltage-current graphs of the (a) PV cell and (b) PD by changing the load resistance when the 500 mW LD is operating at the maximum E/O conversion condition.
    Fig. 6. Voltage-current graphs of the (a) PV cell and (b) PD by changing the load resistance when the 500 mW LD is operating at the maximum E/O conversion condition.
    E/O conversion efficiency of the LD, the O/E conversion efficiency of the optical power receiver, and the total OWPT efficiency as functions of the optical output power of the LD for the following OWPT systems: (a) 200 mW LD and PV cell, (b) 200 mW LD and PD, (c) 500 mW LD and PV cell, and (d) 500 mW LD and PD. The point marked by the arrow in each figure is the point where the E/O conversion efficiency of the LD is the maximum.
    Fig. 7. E/O conversion efficiency of the LD, the O/E conversion efficiency of the optical power receiver, and the total OWPT efficiency as functions of the optical output power of the LD for the following OWPT systems: (a) 200 mW LD and PV cell, (b) 200 mW LD and PD, (c) 500 mW LD and PV cell, and (d) 500 mW LD and PD. The point marked by the arrow in each figure is the point where the E/O conversion efficiency of the LD is the maximum.
    ParameterType of LD
    200 mW500 mW
    Wavelength (nm)850.8850.3
    Electric current (mA)414629
    Electric voltage (V)2.606.01
    Optical output power (mW)298694
    E/O conversion efficiency (%)27.818.4
    Table 1. Operating Condition of the LDs at the Maximum E/O Conversion Efficiency
    Optical power transmitterCE/O (%)Optical power receiverCO/E (%)EBtoB
    200 mW LD27.8PV cell11.933.32
    PD8.042.23
    500 mW LD18.4PV cell11.962.20
    PD6.841.26
    Table 2. OWPT Efficiency When the Optical Power Transmitter Was Operating at the Maximum E/O Conversion Efficiency
    Optical power transmitterCE/O (%)Optical power receiverCO/E (%)EBtoB
    200 mW LD26.1PV cell12.963.39
    27.8PD8.042.23
    500 mW LD13.7PV cell18.82.57
    13.2PD14.11.86
    Table 3. Maximum OWPT Efficiency After the Whole System Optimization
    Sung-Man Kim, Hanbit Park. Optimization of optical wireless power transfer using near-infrared laser diodes[J]. Chinese Optics Letters, 2020, 18(4): 042603
    Download Citation