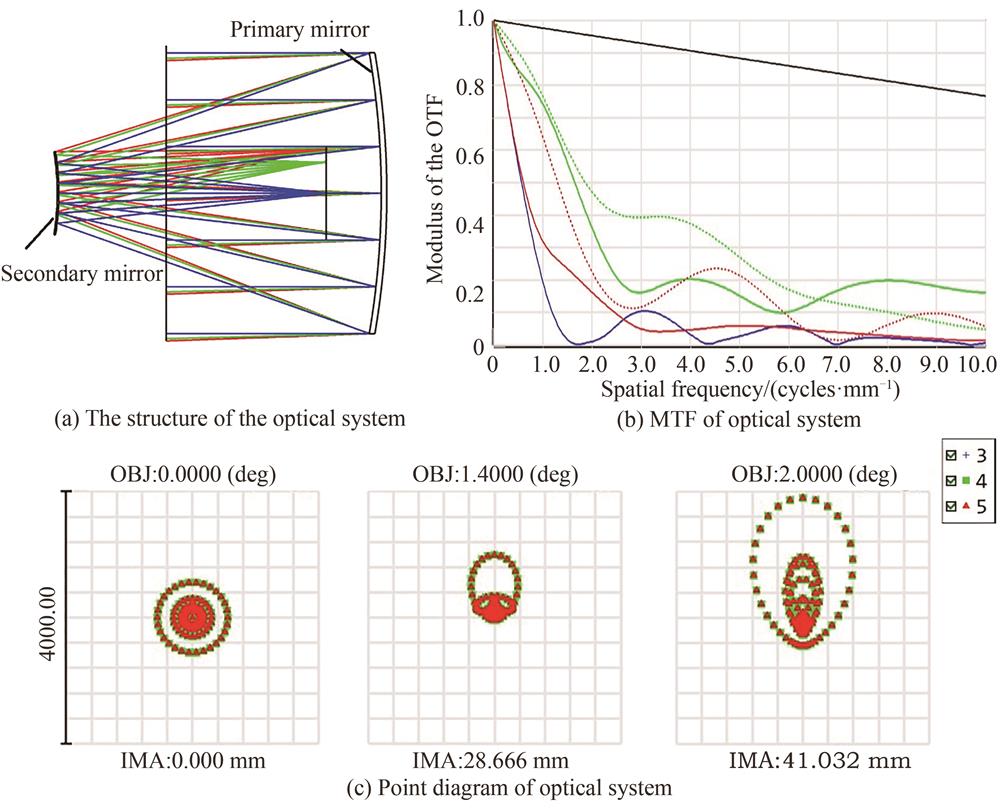
Fig. 1. Design example of RC optical system
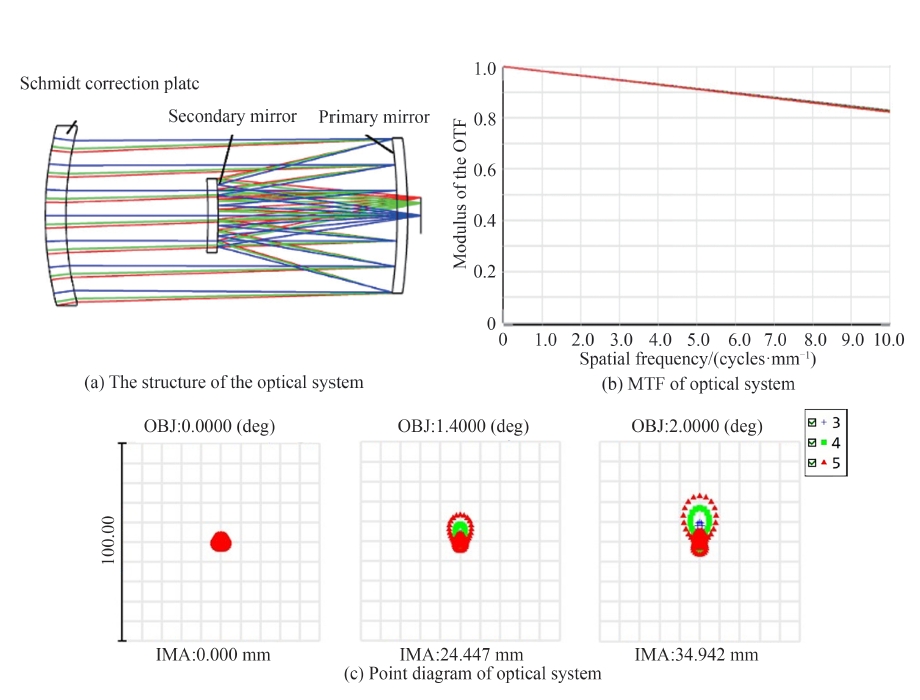
Fig. 2. Design example of Schmidt- Cassegrain optical system
Fig. 3. Design example of off-axis three-mirror optical system
Fig. 4. Mathematical model of structure control
Fig. 5. The structure of the optimized system
Fig. 6. The MTF of the optimized system
Fig. 7. Point diagram of the optimized system
Fig. 8. The in-circle energy of the optimized system
Fig. 9. Field curvature and distortion of the optimized system
Fig. 10. Seidel aberration diagram of the optimized system
Fig. 11. The MTF of the system at different temperatures in the 3~5 μm band
Fig. 12. The MTF of the system at different temperatures in the 8~12 μm band
| Technical index | Index requirements |
|---|
| Focal length | 1 200±5 mm | | Effective caliber | 300±5 mm | | Working band | Medium wave/long wave | | Half field of view | ≥2° | | Root Mean Square (RMS) of the radius of the diffuse spot | ≤25 μm | | Modulation Transfer Function (MTF) | Medium/long wave bands are both greater than 0.4(10 lp/mm) | | Operating temperature | -60℃~+60℃ | | Total length of the system | ≤750 mm |
|
Table 1. Main technical indicators of the system
| Design wavelength/μm | 8 | | 10 | | 12 |
|---|
| p=2 | Resonance order | 2 | 3 | 4 | 5 | 6 | 7 | 2 | 3 | 4 | 5 | 6 | 7 | 2 | 3 | 4 | 5 | 6 | 7 | | Resonance wavelength/μm | 8 | 5.3 | 4 | 3.2 | 2.7 | 2.2 | 10 | 6.7 | 5 | 4 | 3.3 | 2.9 | 12 | 8 | 6 | 5 | 4 | 3.4 | | p=3 | Resonance order | 2 | 3 | 4 | 5 | 6 | 7 | 2 | 3 | 4 | 5 | 6 | 7 | 2 | 3 | 4 | 5 | 6 | 7 | | Resonance wavelength/μm | 12 | 8 | 6 | 4.8 | 4 | 3.4 | 15 | 10 | 7.5 | 6 | 5 | 4.2 | 18 | 12 | 9 | 7.2 | 6 | 5.1 |
|
Table 2. Resonant wavelengths of different design wavelengths
| Material | Density/(g) | Elastic modmodulus/GPa | Specific modulus of elasticity/(×N·mm·g-1) | Thermal conductivity/(W·m-1·K-1) | Thermal expansion coefficien/(·K-1) | Thermal deformation coefficient/(m·W-1) |
|---|
| SiC | 3.05 | 400 | 12.6 | 185 | 2.5 | 1.4 | | Be | 1.85 | 280 | 15.1 | 160 | 11.4 | 7.2 | | Low-expansion glass-ceramic | 2.5 | 92 | 3.7 | 1.46 | 0.05 | 3 | | Low expansion fused silica | 2.2 | 67 | 3.1 | 1.3 | 0.03 | 2.3 |
|
Table 3. Performance of optional mirror substrate materials
| Material | Transmission band/μm | Theoretical transmittance/% | Refractive index n | Elastic modulus/GPa | Thermal conductivity/(W·m-1·K-1) | Thermal expansion coefficient/(·K-1) | Knoop hardness/(kg·) | Breaking strength/MPa |
|---|
| Si | 1.1~9 | 53.9 | 3.426 | 130.91 | 596 (125 K) 163 (313 K) 105.1 (400 K) | -0.5 (75 K) 2.5 (293 K) 4.6 (1400 K) | 1 150 | 70~340 | | Ge | 1.8~23 | 47.1 | 4.003 2 | 103 | 165.8 (125K) 59 (293 K) 43.95 (400 K) | 2.4 (100 K) 6.1 (298 K) 8.0 (1 200 K) | 780 | 90~100 | | Standard ZnS | 1-13 | 75 | 2.20 | 74.5 | 17 (296 K) | 4.6 (173 K) 6.6 (273 K) 7.7 (473 K) | 230~250 | 97.95 | | Standard ZnSe | 0.5~20 | 71 | 2.40 | 70.3 | 18 (300 K) | 5.6 (173 K) 7.1 (273 K) 8.3 (293 K) | 105 | 52.55 | | GaAs | 0.9~15 | 55.85 | 3.276 | 82.68 | 55 (300 K) | 0.9 (75 K) 5.7 (300 K) 7.3 (1 000 K) | - | 130 | | CaF2 | 0.13~12 | 94 | 1.43 | 75.79 | 8.4 | 18.7 | 158 | 37 |
|
Table 4. Performance analysis of optional refractive/refractive diffractive lens materials
| Operand | Surface1 | Surface2 | Value | Minimum | Maximum |
|---|
| COMP | 16 | — | -50 | -50 | 50 | | TWAV | — | — | — | 4(10) | — | | TRAD | 3 | — | -1999.900 | -0.02 | 0.02 | | TRAD | 6 | — | -666.652 | -0.02 | 0.02 | | TRAD | 9 | — | -999.950 | -0.02 | 0.02 | | TRAD | 11 | — | 2728.675 | -0.2 | 0.2 | | TRAD | 12 | — | 2406.081 | -0.2 | 0.2 | | TRAD | 13 | — | 1054.373 | -0.2 | 0.2 | | TRAD | 14 | — | 916.156 | -0.2 | 0.2 | | TRAD | 15 | — | 1439.644 | -0.2 | 0.2 | | TRAD | 16 | — | 1112.167 | -0.2 | 0.2 | | TETX | 3 | 3 | — | -0.018 | 0.018 | | TETX | 6 | 6 | — | -0.018 | 0.018 | | TETX | 9 | 9 | — | -0.018 | 0.018 | | TTHI | 1 | 2 | 600.000 | -0.2 | 0.2 | | TTHI | 4 | 5 | -499.975 | -0.2 | 0.2 | | TTHI | 7 | 8 | 499.975 | -0.2 | 0.2 | | TTHI | 10 | 12 | -600.000 | -0.2 | 0.2 | | TTHI | 11 | 12 | -13.166 | -0.2 | 0.2 | | TTHI | 12 | 14 | -11.801 | -0.2 | 0.2 | | TTHI | 13 | 14 | -13.855 | -0.2 | 0.2 | | TTHI | 14 | 16 | -27.165 | -0.2 | 0.2 | | TTHI | 15 | 16 | -23.399 | -0.2 | 0.2 |
|
Table 5. Final tolerance distribution
| Test wavelength/μm | Nomimol/μm | Best/μm | The surface for the best results | Worst/μm | The surface of the worst results | 90%>/μm | 80%>/μm | 50%>/μm | 20%>/μm | 10%>/μm |
|---|
| 4 | 9.932 | 9.966 | 11 | 28.964 | 19 | 24.032 | 22.089 | 15.796 | 11.907 | 11.544 | | 10 | 9.076 | 9.839 | 3 | 31.187 | 14 | 22.770 | 19.863 | 14.095 | 11.403 | 11.012 |
|
Table 6. Tolerance analysis results
| The main parameters | Technical index | Design result |
|---|
| System focal length/mm | 1 200±5 | 1 200 | | Effective caliber/mm | 300±5 | 300 | | Half field of view/(°) | ≥±2 | ±2 | | Working band/μm | Medium wave/long wave | 3~5 μm/8~12 μm | | MTF@10 lp/mm | ≥0.4 | ≥0.6(3~5 μm) ≥0.45(8~12 μm) | | Diffuse spot radius(RMS)/μm | ≤25 | 18.335(3~5 μm) 15.811(8~12 μm) |
|
Table 7. Comparison of design results and corresponding technical indicators