
G. Cristoforetti, S. Hüller, P. Koester, L. Antonelli, S. Atzeni, F. Baffigi, D. Batani, C. Baird, N. Booth, M. Galimberti, K. Glize, A. Héron, M. Khan, P. Loiseau, D. Mancelli, M. Notley, P. Oliveira, O. Renner, M. Smid, A. Schiavi, G. Tran, N. C. Woolsey, L. A. Gizzi, "Observation and modelling of stimulated Raman scattering driven by an optically smoothed laser beam in experimental conditions relevant for shock ignition," High Power Laser Sci. Eng. 9, 04000e60 (2021)
- High Power Laser Science and Engineering
- Vol. 9, Issue 4, 04000e60 (2021)
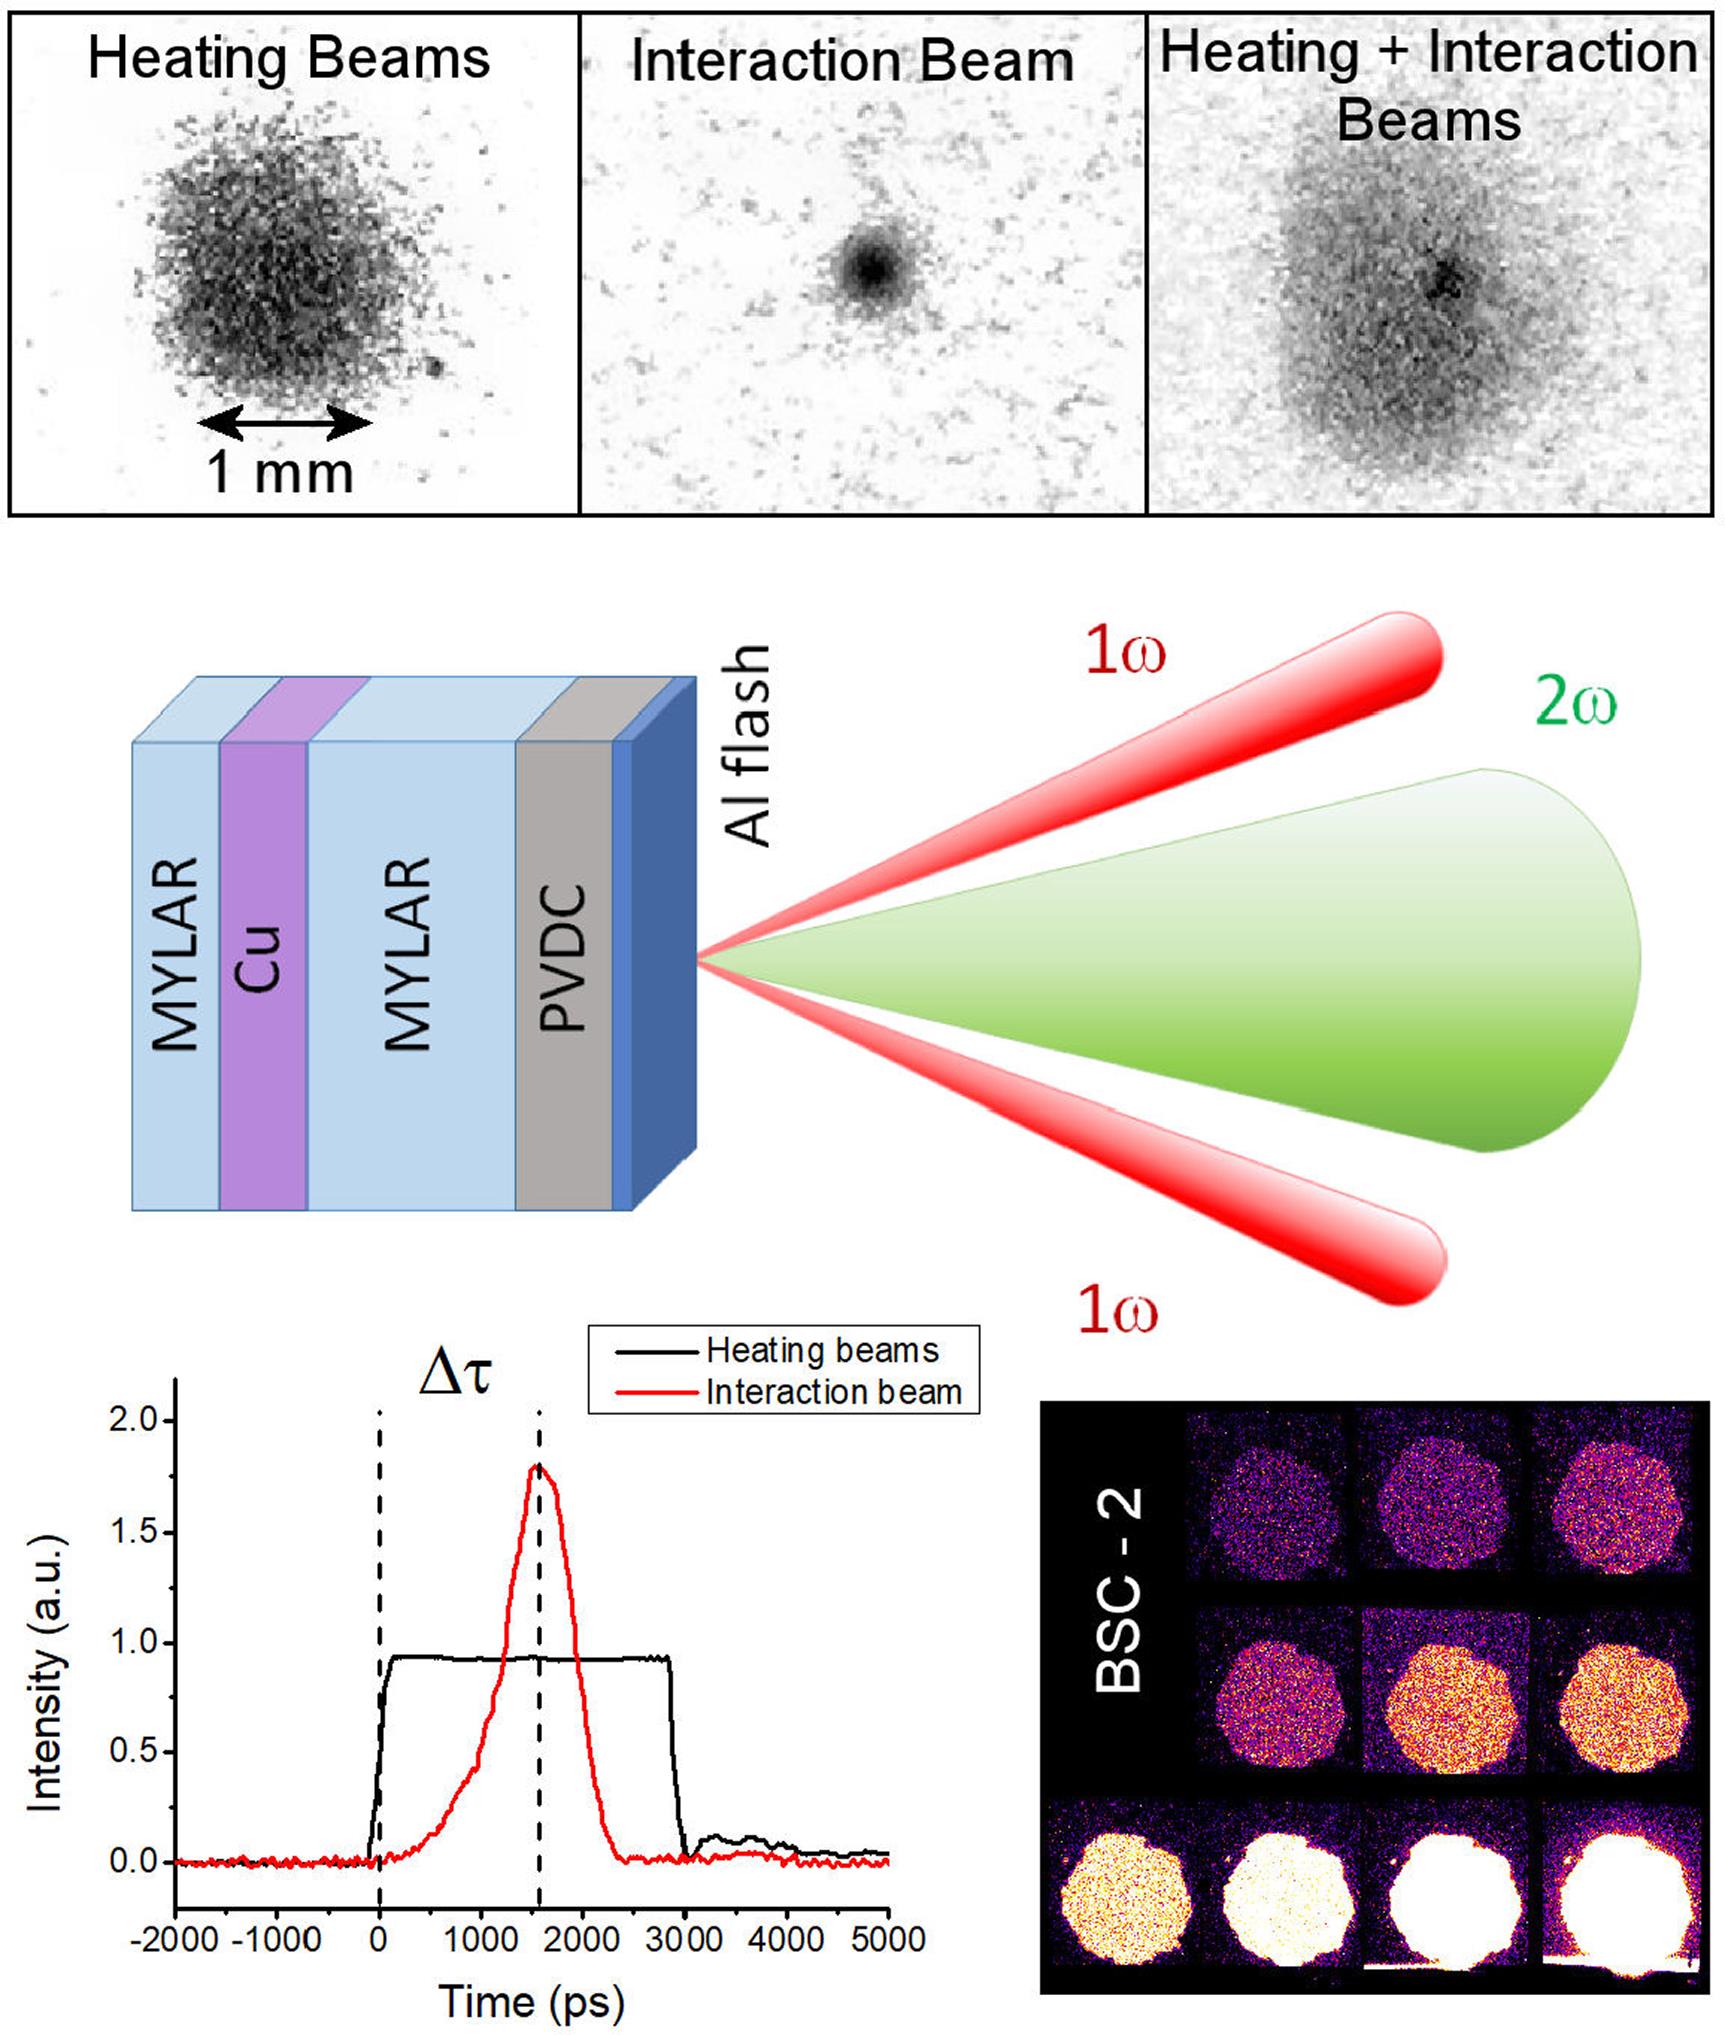
Fig. 1. Top, pinhole camera images of hard X-ray emission from plasmas induced by the heating pulses, by the interaction pulse and by all the beams. Middle, sketch of the beam configuration in the vertical plane and target structure. Bottom-left, timing of the laser beams (relative intensity is arbitrary). Bottom-right, image plate signal, obtained in calibration shot on copper targets, acquired by the Bremsstrahlung cannon (BSC) looking at the rear side of the target; the intensity is proportional to photostimulated luminescence (PSL).
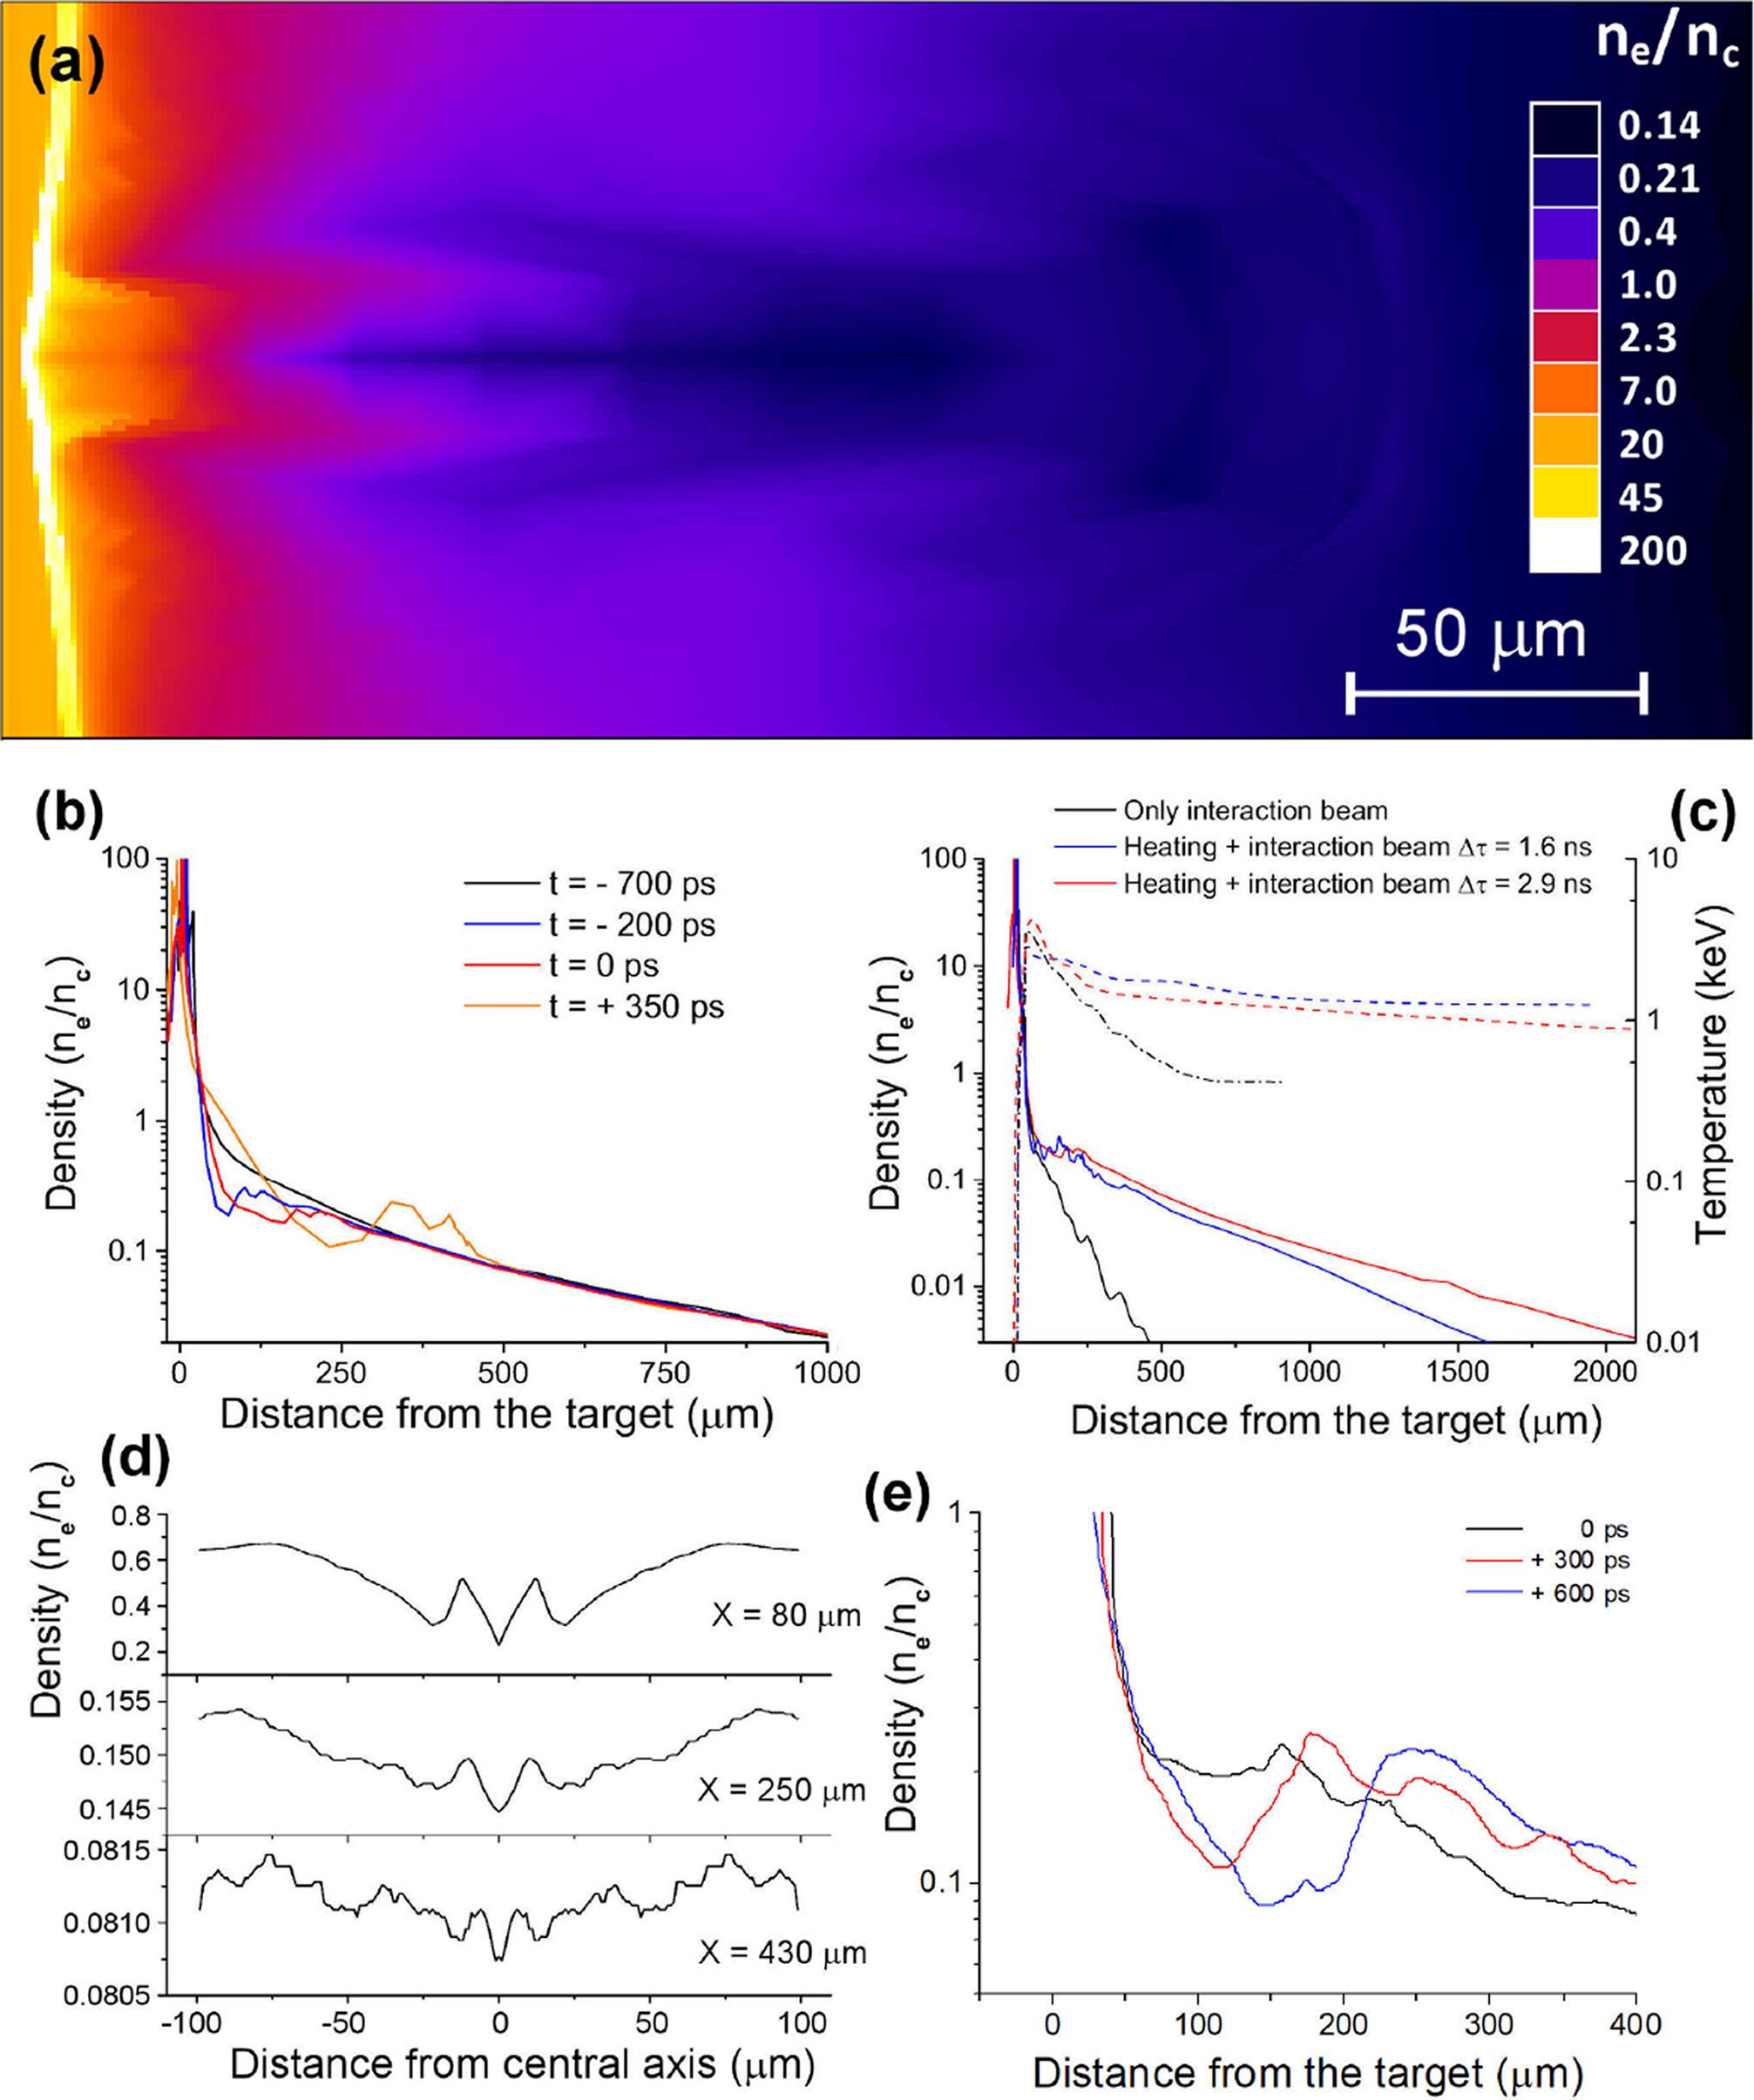
Fig. 2. Density and temperature profiles obtained from hydrodynamic simulations carried out with the DUED code: (a) 2D map of electron density in the high-density region taken at the peak of the interaction pulse, in the case of delay time  ns; (b) longitudinal profiles of electron density at different times of interaction in the case of delay time
  ns; (c) longitudinal profiles of electron density and temperature taken at the peak of the interaction pulse for delay times
  ns (blue lines),
  ns (red lines) and for the case where heating beams are not used (black lines); (d) transverse density profiles taken at different distances from the target surface in the same conditions as (a); (e) temporal evolution of the dip in the density profile.
ns; (b) longitudinal profiles of electron density at different times of interaction in the case of delay time ns; (c) longitudinal profiles of electron density and temperature taken at the peak of the interaction pulse for delay times ns (blue lines), ns (red lines) and for the case where heating beams are not used (black lines); (d) transverse density profiles taken at different distances from the target surface in the same conditions as (a); (e) temporal evolution of the dip in the density profile. Fig. 3. X-ray spectrum of K-shell chlorine emission from H- and He-like atoms. The measured spectrum includes the contributions of the fourth and the fifth diffraction orders of the crystal.
Fig. 4. Experimental results: (a) SRS reflectivity versus laser intensity for a set of selected data with fixed values of  ns and
  μm; (b) SRS reflectivity versus the delay time
  between heating and interaction beams; (c) typical SRS spectrum; (d) time profile of SRS light in shots with different delay times
  . In subplot (a), error bars of 20% are also reported for reference.
ns and μm; (b) SRS reflectivity versus the delay time between heating and interaction beams; (c) typical SRS spectrum; (d) time profile of SRS light in shots with different delay times . In subplot (a), error bars of 20% are also reported for reference. Fig. 5. Time-resolved SRS spectra acquired in two different shots by the Hamamatsu C7700 (on the left) and C5680 (on the right) streak cameras. Time resolution is 18 ps. The laser fiducial in the left-hand image allowed us to determine the absolute timing of the interaction laser peak. The left- and right-hand panels show the SRS spectra scattered at low and high plasma densities, respectively. The dashed line shows the spectral shift of SRS scattered light with time at densities around 
n c.
Fig. 6. (a) Synthetic Bremsstrahlung X-ray emission spectra obtained by HE populations of different  temperatures, resulting from Geant4 simulations. (b) Typical heat map of
  for different (
 ,
, ) combinations; the grey line represents the locus of minimum
  , while the projections on the axes show that the optimal fit consists of
  keV and
  J.
J.
temperatures, resulting from Geant4 simulations. (b) Typical heat map of for different (,) combinations; the grey line represents the locus of minimum , while the projections on the axes show that the optimal fit consists of keV and J. Fig. 7. Values of total SRS reflectivity (blue) calculated by using Equation (2) . Red and yellow lines indicate the contributions given by non-saturated (first term in Equation (2) ) and saturated (second term in Equation (2) ) speckles. The inset represents the graph in logarithmic scale.
Fig. 8. Time evolution of SRS gain calculated by using Equation (4) for the laser beam configurations with time delay  0.9, 1.9 and 2.9 ns between heating and interaction beams. Dashed and solid lines indicate the gains calculated by using the Rosenbluth theory and the modified expression,
 Equation (4) , respectively, accounting for Landau damping in a speckle.
0.9, 1.9 and 2.9 ns between heating and interaction beams. Dashed and solid lines indicate the gains calculated by using the Rosenbluth theory and the modified expression, Fig. 9. Spectra of the backscattered light from simulations with SIERA for an RPP beam at  W/cm2 and for a density ramp 0.02
  0.10, left/right subplots without/with taking into account kinetic effects.
W/cm2 and for a density ramp 0.02 0.10, left/right subplots without/with taking into account kinetic effects. Fig. 10. Complementary distribution function  as a function (blue line) of the electron energy
  from a typical simulation with SIERA for an RPP beam at
  W/cm2 and for a density ramp 0.02
  0.10. The tail of the distribution evolves versus HE distribution (black line)
  with
with  8 keV here, that is, in the range of the experimentally observed values. The position of the energy corresponding to the EPW phase velocity is indicated (dotted line at approximately 5 keV).
as a function (blue line) of the electron energy from a typical simulation with SIERA for an RPP beam at W/cm2 and for a density ramp 0.02 0.10. The tail of the distribution evolves versus HE distribution (black line) with 8 keV here, that is, in the range of the experimentally observed values. The position of the energy corresponding to the EPW phase velocity is indicated (dotted line at approximately 5 keV). Fig. 11. Normalized transverse field strength  (upper subplot) and electron density perturbations (lower subplot)
  as a function of space for a single laser speckle with peak field strength
  0.1. The self-focusing speckle shows an elongated structure on axis (
 180) with a field strength higher than the initial value
  . The laser light enters from the left,
  0. The dashed lines in both subplots indicate the zones where SRS is amplified: the density perturbations (note that the range shown in
  is reduced with respect to the upper subplot) exhibit plasma wave oscillations in the periphery of the field hot spot, but not in the depleted zone inside. SRS-driven EPWs are in particular present at the rear on axis and in the side wings. SBS-driven ion acoustic waves are found in the front part (PIC simulations show generally too high values).
(upper subplot) and electron density perturbations (lower subplot) as a function of space for a single laser speckle with peak field strength 0.1. The self-focusing speckle shows an elongated structure on axis (180) with a field strength higher than the initial value . The laser light enters from the left, 0. The dashed lines in both subplots indicate the zones where SRS is amplified: the density perturbations (note that the range shown in is reduced with respect to the upper subplot) exhibit plasma wave oscillations in the periphery of the field hot spot, but not in the depleted zone inside. SRS-driven EPWs are in particular present at the rear on axis and in the side wings. SBS-driven ion acoustic waves are found in the front part (PIC simulations show generally too high values). 

Set citation alerts for the article
Please enter your email address

© Copyright 2018-2021 | Chinese Laser Press. All Rights Reserved 沪ICP备15018463号-20