• Chinese Physics B
  • Vol. 29, Issue 9, (2020)
Ya-Nan Sun1、4, Yan-Hui Wang2, Le-Le Song1、3, Hai-Bin Du5, Xiao-Chun Wang1、4, Lan-Lai He1、4, Si-Zuo Luo1、4, Qin Yang1、4, Jing Leng1、4, and Fu-Chun Liu1、4、†
Author Affiliations
  • 1Institute of Atomic and Molecular Physics, Jilin University, Changchun 3002, China
  • 2College of Electronic Science and Engineering, State Key Laboratory on Integrated Optoelectronics, Jilin University, Changchun 13001, China
  • 3Jilin Institute of Chemical Technology, Jilin 12022, China
  • 4Jilin Provincial Key Laboratory of Applied Atomic and Molecular Spectroscopy, Jilin University, Changchun 130012, China
  • 5Department of Comprehensive, Harbin City Vocational College, Haerbin 10000, China
  • show less
    DOI: 10.1088/1674-1056/ab9431 Cite this Article
    Ya-Nan Sun, Yan-Hui Wang, Le-Le Song, Hai-Bin Du, Xiao-Chun Wang, Lan-Lai He, Si-Zuo Luo, Qin Yang, Jing Leng, Fu-Chun Liu. Photoelectron imaging on vibrational excitation and Rydberg intermediate states in multi-photon ionization process of NH3 molecule[J]. Chinese Physics B, 2020, 29(9): Copy Citation Text show less
    Vibrational levels in different excited states of NH3 and NH3+ without the existence of ponderomotive force potential. Single arrow represents the energy of a photon, and double arrow refers to the detected kinetic energy (KE) of electrons.
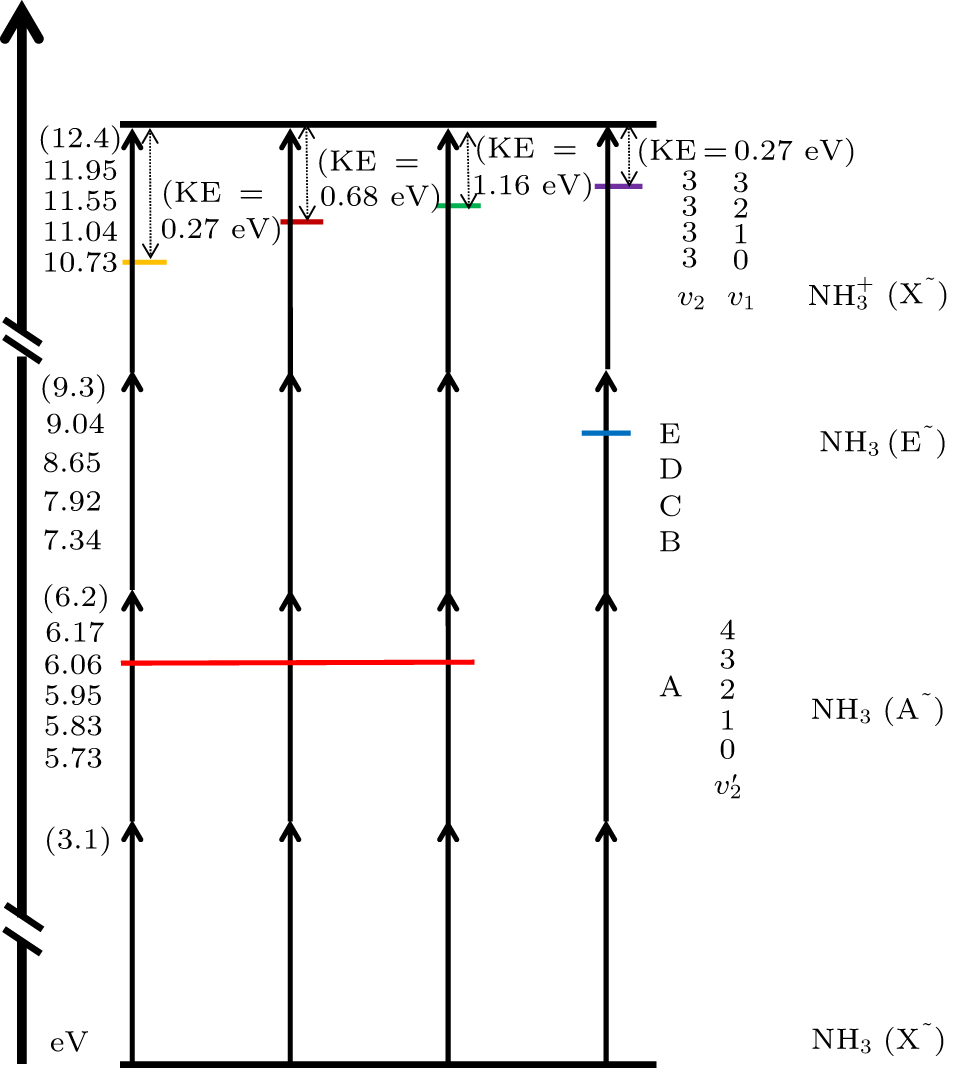
    Fig. 1. Vibrational levels in different excited states of NH3 and NH3+ without the existence of ponderomotive force potential. Single arrow represents the energy of a photon, and double arrow refers to the detected kinetic energy (KE) of electrons.
    Photoelectron images of NH3 molecules. The laser wavelength is 400 nm, and the intensity range is 1.01 × 10¹³ W/cm2–1.01 × 1014 W/cm2. (a)–(n) Corresponding photoelectron distribution images with the laser intensity of 1.01, 1.27, 1.52, 1.90, 2.53, 3.17, 3.80, 4.43, 5.07, 5.70, 6.30, 7.60, 8.87, 10.10 × (1013 W/cm2). Horizontal and vertical coordinates are x and y pixels of CCD, respectively, and the direction of laser polarization is represented by arrows.
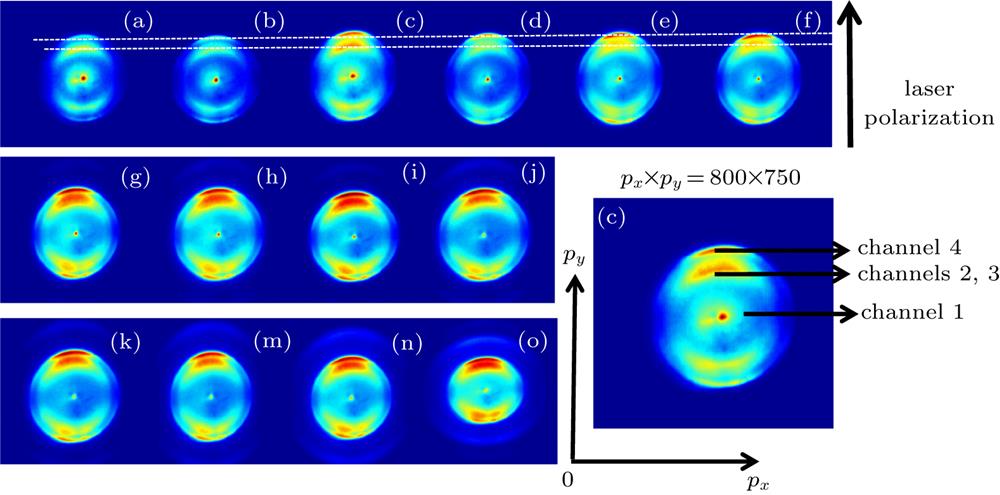
    Fig. 2. Photoelectron images of NH3 molecules. The laser wavelength is 400 nm, and the intensity range is 1.01 × 10¹³ W/cm2–1.01 × 1014 W/cm2. (a)–(n) Corresponding photoelectron distribution images with the laser intensity of 1.01, 1.27, 1.52, 1.90, 2.53, 3.17, 3.80, 4.43, 5.07, 5.70, 6.30, 7.60, 8.87, 10.10 × (1013 W/cm2). Horizontal and vertical coordinates are x and y pixels of CCD, respectively, and the direction of laser polarization is represented by arrows.
    Kinetic energy distributions from slow electrons within the range of 0 eV–3.1 eV with laser intensities being 1.0, 1.27, 1.52, 1.90, 2.53, 3.17, 3.80, 4.43, 5.07, 5.70, 6.30, 7.60, 8.87, and 10.1 × (1013 W/cm2).
    Fig. 3. Kinetic energy distributions from slow electrons within the range of 0 eV–3.1 eV with laser intensities being 1.0, 1.27, 1.52, 1.90, 2.53, 3.17, 3.80, 4.43, 5.07, 5.70, 6.30, 7.60, 8.87, and 10.1 × (1013 W/cm2).
    Kinetic energy distributions of fast electrons within the range of 3.1 eV–10 eV with laser intensities being 1.01, 1.27, 1.52, 1.90, 2.53, 3.17, 3.80, 4.43, 5.07, 5.70, 6.30, 7.60, 8.87, and 10.1 × (1013 W/cm2).
    Fig. 4. Kinetic energy distributions of fast electrons within the range of 3.1 eV–10 eV with laser intensities being 1.01, 1.27, 1.52, 1.90, 2.53, 3.17, 3.80, 4.43, 5.07, 5.70, 6.30, 7.60, 8.87, and 10.1 × (1013 W/cm2).
    Angular distributions of peaks 1, 2, 3, and 4, corresponding to 1.01 × 10¹³ W/cm2 laser intensity.
    Fig. 5. Angular distributions of peaks 1, 2, 3, and 4, corresponding to 1.01 × 10¹³ W/cm2 laser intensity.
    Angular distributions of peak 4 at different laser intensities.
    Fig. 6. Angular distributions of peak 4 at different laser intensities.
    Angular distribution of peak 5 at laser intensity 5.07 × 10¹³ W/cm2.
    Fig. 7. Angular distribution of peak 5 at laser intensity 5.07 × 10¹³ W/cm2.
    Angular distribution of peaks 4, 5, and 6 at the 5.07 × 10¹³-W/cm2 laser intensity.
    Fig. 8. Angular distribution of peaks 4, 5, and 6 at the 5.07 × 10¹³-W/cm2 laser intensity.
    Results and identification for multi-photon processes of ammonia in the 400-nm wavelength laser field. Colored arrows in this picture illustrate different multi-photon processes; all photons have the 400-nm wavelength.
    Fig. 9. Results and identification for multi-photon processes of ammonia in the 400-nm wavelength laser field. Colored arrows in this picture illustrate different multi-photon processes; all photons have the 400-nm wavelength.
    NH3 (A)v2
    V2=0V2=1V2=2V2=3V2=4V2=5
    Excitation energy/eV5.735.835.956.066.176.29
    (X∼)v2
    Ionization energy/eVV2 = 2V2 = 3V2 = 4V2 = 5
    V1 = 010.6410.7310.8210.91
    V1 = 111.0411.1411.2411.32
    V1 = 211.4611.5511.6411.73
    V1 = 311.8611.9512.04
    Table 1. In non-ponderomotive force case, values of energy needed for ammonia molecule to transform from the X state to different vibration levels of (upper) A state and (lower) ammonia ion.
    Ya-Nan Sun, Yan-Hui Wang, Le-Le Song, Hai-Bin Du, Xiao-Chun Wang, Lan-Lai He, Si-Zuo Luo, Qin Yang, Jing Leng, Fu-Chun Liu. Photoelectron imaging on vibrational excitation and Rydberg intermediate states in multi-photon ionization process of NH3 molecule[J]. Chinese Physics B, 2020, 29(9):
    Download Citation