
Yichong Zhu, Yuan Ji. OLED-on-Silicon Micro-Display Based on Asymmetric Elliptical Foveated JND Model[J]. Chinese Journal of Lasers, 2023, 50(19): 1909002
- Chinese Journal of Lasers
- Vol. 50, Issue 19, 1909002 (2023)
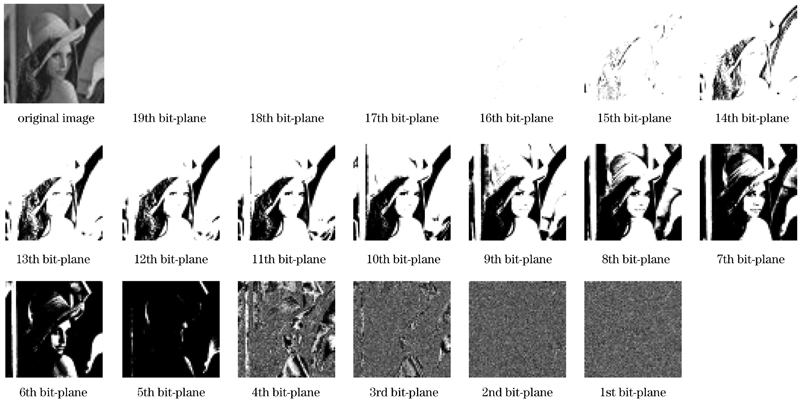
Fig. 1. 19-bit-plane image features of Lena
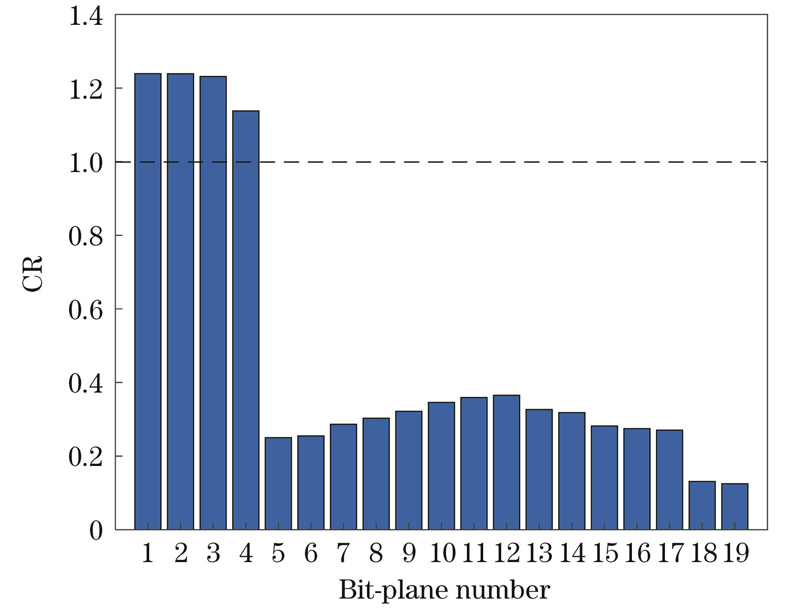
Fig. 2. 19-bit-plane CR distribution of Lena
Fig. 3. Distribution of field of view test points
Fig. 4. Image for exploring luminance masking effect
Fig. 5. Image for exploring contrast masking effect
Fig. 6. Asymmetric foveated concave fitting ellipse
Fig. 7. Subjective experimental results for luminance masking experiment. (a) Relationship between JND and eccentricity;
Fig. 8. Subjective experimental results for contrast masking experiment. (a) Relationship between JND and contrast; (b) relationship among JND, contrast and luminance; (c) JND value distribution in foveated range
Fig. 9. Noise injection distribution of three kinds of JND models. (a) Original image; (b) model in Ref. [12]; (c) model in Ref. [11];
Fig. 10. Enlarged view of central area after noise pollution for three JND models. (a) Image after noise pollution; (b) model in Ref. [12]; (c) model in Ref. [11]; (d) our model
Fig. 11. Hardware system. (a) Overall framework; (b) picture of hardware test platform
Fig. 12. Comparison of 19-bit-plane compression ratio distribution of Lena before and after algorithm processing
Fig. 13. Compression effect comparison of images and partially enlarged view. (a) Original image; (b) model in Ref. [11]; (c) our model
|
Table 1. Performance parameters of VR glasses based on OLED-on-silicon micro-display
|
Table 2. Stimulus attributes for luminance masking and contrast masking experiments
| |||||||||||||||||||||||||||||||||||||||||||||||||||||||||||||||
Table 3. Comparison of MOSs of JND models under same PSNR
|
Table 4. Comparison of low 4-bit-plane compression ratio of Lena before and after algorithm processing
| |||||||||||||||||||||||||||||||||||||||||||||||||||||||||||||||||||||||||||||||||||||||||||||||||||||||||||||||||||||||||||||||||||||||||||||||||||||||||||||||||||||||||||||||||||||||||||||||||||||
Table 5. Comparison of evaluation indexes and compression ratio of different compression algorithms for color image compression
|
Table 6. Evaluation index and compression ratio comparison of bit-plane compression algorithms

Set citation alerts for the article
Please enter your email address
© Copyright 2018-2021 | Chinese Laser Press. All Rights Reserved 沪ICP备15018463号-20