
Xiahui Tang, Yingxiong Qin, Hao Peng, Yujie Li, Yang Wu, Longsheng Xiao, Yu Xiao, Juan Liu. High-Power Radio-Frequency Slab CO2 Laser[J]. Chinese Journal of Lasers, 2022, 49(12): 1201005
- Chinese Journal of Lasers
- Vol. 49, Issue 12, 1201005 (2022)
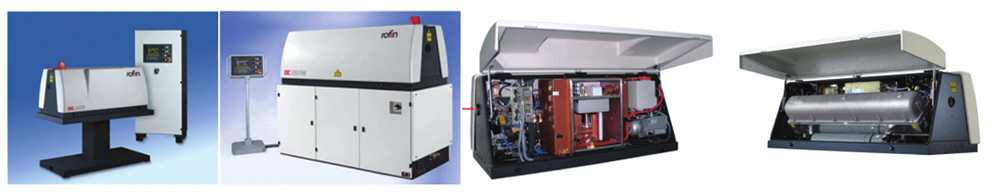
Fig. 1. German Rofin radio frequency (RF) slab CO2 laser products

Fig. 2. Schematic of RF slab CO2 gas laser
Fig. 3. Temperature distribution of discharge electrode
Fig. 4. Actual structure drawing of lath
Fig. 5. Schematic of three-channel parallel serpentine-like runner structure and its machining pattern. (a) Structural diagram; (b) machining pattern
Fig. 6. Temperature field distribution maps. (a) Temperature field distribution diagram of front shaft side; (b) temperature field distribution diagram of opposite shaft side
Fig. 7. Structural diagram of waveguide unstable mixing cavity
Fig. 8. Schematic of one-dimensional negative branch axis confocal unstable resonator
Fig. 9. Schematic of light field in slab waveguide direction
Fig. 10. Schematic of negative axis confocal unstable intracavity beam
Fig. 11. Comparison between numerical simulation and experimental results of two unstable cavity light field modes[20]
Fig. 12. Schematic of external light path shaping
Fig. 13. Change rule of output beam in two directions behind the cylindrical mirror M2
Fig. 14. Theoretical simulation diagrams and experimental diagram of intensity distribution of shaped beam in front of spherical mirror 8. (a) Light intensity distribution in unstable direction; (b) light intensity distribution in waveguide direction; (c) top view of light intensity distribution; (d) experimental results
Fig. 15. Light intensity distributions of shaped beam transmitted to different distances after passing through cylindrical lens M2. (a) z=200 mm; (b) z=400 mm; (c) z=800 mm; (d) z=1500 mm
Fig. 16. Beam radius changes in two directions of shaped beam after passing through spherical mirror 8
Fig. 17. Numerical simulation and experimental diagrams of light intensity distribution after shaped beam transmits 2000 mm
Fig. 18. Numerical simulation and experimental results of intensity distribution of shaped beam at 800 mm and 3800 mm. (a) Numerical simulation at 800 mm; (b) numerical simulation at 3800 mm; (c) experimental result at 800 mm; (d) experimental result at 3800 mm
|
Table 1. Main parameters of Rofin RF slab CO2 laser


Set citation alerts for the article
Please enter your email address

© Copyright 2018-2021 | Chinese Laser Press. All Rights Reserved 沪ICP备15018463号-20