
Ye Yuan, Yan Zhang, Cheng Guo, Xiaolu Kang, Zhong Yan, Xiaoping Huang, Qing Zhao, "Optical analysis method for fast plasma characterization of high-speed miniaturized synthetic jet," Chin. Opt. Lett. 20, 073001 (2022)
- Chinese Optics Letters
- Vol. 20, Issue 7, 073001 (2022)
Abstract
Keywords
1. Introduction
The optical spectral diagnosis is widely used nowadays in plasma characterization[
Narayanaswamy et al.[
The above studies are based on the measured spectral data to calculate the plasma characteristic parameters such as plasma density and temperature, which is also a conventional method for spectral diagnosis of plasma. However, one disadvantage of this method is that it is difficult to realize high-speed measurement because the spectrum contains a large amount of information. To solve this problem, we propose a new optical analysis method for plasma characterization, which creatively connects the luminous color with the plasma characteristics, establishes the corresponding relationship between them, and obtains the plasma characteristics by measuring the luminous color of the plasma. Now, there are already many advanced spectrometers, such as SpectraPro HRS with the aid of ICCD and PI-MAX, which have a nanosecond time resolution. However, most of these spectrometers have a very high cost, which is at least ¥400,000. Moreover, some fast plasma experiments especially in some emergency situations should be carried out to get the plasma characteristics. A simple and auxiliary function method should be proposed to measure discharge, which can take the place of the advanced imaging spectrometers sometimes. Our method is a fast and simple method to characterize the electron temperature and electron density based on the luminous color. There are two major advantages for our method in certain conditions. First, we have a fast process for obtaining the characteristic results from the luminous image color. One can get the first-hand data quickly, especially in emergency situations. Second, one can quickly make a rough estimation by our method if he is familiar with the luminous characteristics of plasma, which is easy for a researcher in plasma. Moreover, our method is very convenient, timely, and rapid for the application of plasma engineering. Our method provides a plasma characteristic analyzing method based on luminous color with a fast imaging record. Only three chromatic sensors are needed to record the chromatic intensities in our method. Spectral measurement uses a spectrometer to disperse incident light into a spectrum through some lenses and gratings, wherein the spectrum shines on the sensor of a linear array or area array. Usually, 2048 array sensors are used to record the light intensities to obtain 2048 pixels amplitudes. So, our method can greatly save many hardware resources, which improves the hardware running speed to increase the measurement speed.
The article is arranged as follows: the second part introduces the experimental instrument, the third part introduces the optical analysis method for plasma characterization, the fourth part is the experimental and calculation results and analysis, and the fifth part summarizes the full text.
2. Experimental Instruments
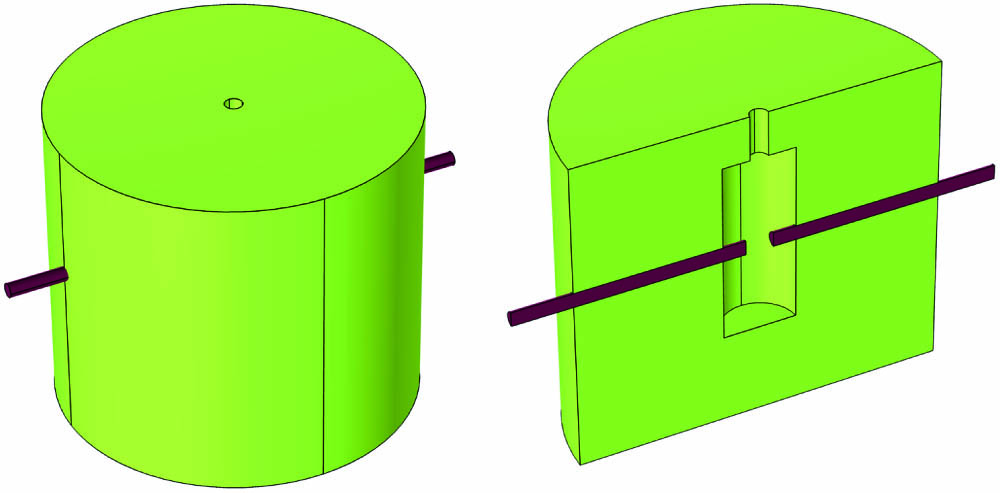
The discharge form in the cavity of the actuator is arc discharge in the gap between the electrodes[
![]()
Figure 1.Structure of the plasma synthetic jet actuator.
3. Optical Analysis Method for Plasma Characterization
According to the measured spectra, we can calculate the color of light and the plasma characteristics such as electron temperature and electron density. The new optical analysis method for plasma characterization proposed by us is to first obtain the color and plasma characteristics by spectral calculation, repeat this step under different working conditions, and obtain a database of color and plasma characteristics corresponding to working conditions. After the database is established, it is no longer necessary to measure the spectra. Instead, the color information is obtained directly by taking photos, and then the plasma characteristics corresponding to the colors are directly queried in the previously established database. Because the spectrum contains a large amount of information, it is a dot matrix containing many data points, and the color is only a three-channel data point, so the color acquisition speed will be much higher than the spectrum acquisition speed, which is easier to realize high-speed measurement. Building the database is our next step for working plan. In this paper, we only demonstrate the feasibility of this method. Next, the method of calculating luminous color and plasma characteristics by the spectrum is introduced.
3.1. Luminous color calculation method
We use MATLAB programming to calculate the luminous color of plasma from the spectral data. The International Commission on Illumination (CIE) XYZ trichromatic system is generally used to characterize the color, where the color is decomposed into three primary colors: X, Y, and Z. The color can be uniquely determined by the coordinates of the three basic vectors X, Y, and Z. This color is the linear superposition of the three components X, Y, and Z. To calculate the coordinates of the XYZ system, we need to use the “light transmittance curve of human cornea,” namely color matching functions (CMFs). This is the intensity portion of the unit luminous intensity received by the X, Y, and Z human eye sensors under different spectral wavelengths; that is, three curves with the wavelength as the abscissa axis, as shown in Fig. 2. Here, we use the CMF under CIE 1931 specification and use the interpolation function to obtain the CMF values at the wavelength points of the measured spectral data. We multiply the normalized spectral values by the CMF values of X, Y, and Z, respectively, and integrate them in the whole wavelength range to obtain the X, Y, and Z values. We divide these three values by X + Y + Z to obtain the normalized
![]()
Figure 2.Light transmittance curve of the human cornea.
3.2. Diagnostic method for plasma characterization
Plasma electron temperature is diagnosed using the Boltzmann plot method[
If local thermodynamic equilibrium (LTE) is reached in the plasma, according to Boltzmann’s law, the intensity
We pick up several spectral lines of the same particle and calculate the value of
The plasma electron density is diagnosed using the Stark broadening method[
The broadening of a Gaussian shape can be expressed as
The broadening of a Lorentzian shape can be expressed as
After we obtained
4. Results and Analysis
The plasma emission spectra in the visible range with different capacitances at the electrode spacing of 1.9 mm are obtained, as shown in Fig. 3. The plasma emission spectra with capacitance of 0.16 µF at different electrode spacings are shown in Fig. 4. It can be seen from the figures that some sharp spectral lines appear in the emission spectra of plasma under different working conditions. The wavelength positions of sharp lines in these six figures almost stay the same. However, there are some different sharp lines absent in different working conditions.
![]()
Figure 3.Plasma emission spectra in the visible range with different capacitances at the electrode spacing of 1.9 mm. (a) Spectrum at 0.16 µF, (b) spectrum at 0.32 µF, and (c) spectrum at 0.48 µF.
![]()
Figure 4.Plasma emission spectrum in the visible range with 0.16 µF at different electrode spacings. (a) Spectrum at the electrode spacing of 1.9 mm, (b) spectrum at the electrode spacing of 3 mm, and (c) spectrum at the electrode spacing of 4.5 mm.
The plasma luminous color, electron temperature, and electron density under different working conditions are calculated and shown in Fig. 5. The normalized red, green, and blue components of RGB are also marked in the figure. As can be seen from Fig. 5(a), the electron temperature increases with the increase of capacitance. This is because increasing the capacitance means increasing the energy stored in the capacitor; that is, the input work of the actuator increases, so the energy deposited during discharge increases. Therefore, the heat energy released during the discharge increases, resulting in the increase of the plasma gas temperature. Due to the LTE, the electron temperature is equal to the gas temperature, so the electron temperature increases. It can also be seen from Fig. 5(a) that the electron density increases with the increase of capacitance. This is because, with the increase of capacitance, the discharge voltage is basically unchanged, so the energy obtained by a single electron when being accelerated in the electric field remains unchanged. As mentioned above, the total discharge energy increases, so the number of electrons accelerated in the electric field increases, and the number of ionization reactions and electron density increase. As can be seen from Fig. 5(a), under the calculated working conditions, the plasma luminescence is different light yellows. Among them, the corresponding luminous color with the plasma characteristics of electron temperature at 5344 K and electron density of
![]()
Figure 5.Comparison diagram of plasma luminescence color, electron temperature, and electron density under different working conditions. (a) Comparison diagram of plasma luminescence color, electron temperature, and electron density under different capacitances at electrode spacing of 1.9 mm, and (b) comparison diagram of plasma luminescence color, electron temperature, and electron density under different electrode spacings when capacitance is 0.16 µF.
![]()
Figure 6.Comparison between measured color and calculated color.
As can be seen from Fig. 5(b), as the electrode spacing increases, the electron temperature decreases. Due to the LTE, the gas temperature decreases. The reason is as follows. First, with the increase of spacing, the air flow and heat exchange area become larger. Second, with the increase of spacing, the arc length is longer, which leads to the decrease of current density, resulting in the decrease of Joule heat released by the arc. Due to these two points, the heat generated is smaller and dissipated more, so the temperature decreases. As can be seen from Fig. 5(b), with the increase of electrode spacing, the electron density increases. This is because with the increase of electrode spacing, the discharge has more difficulty happening, the breakdown voltage increases, and the increase of spacing is faster than the increase of voltage, as a result, the electric field intensity decreases. When a single electron is accelerated in the electric field, the energy obtained by the electron is directly proportional to the electric field intensity. Therefore, the energy obtained by a single electron decreases. Meanwhile, the discharge voltage increases with the increase of electrode spacing, and thus the total discharge energy increases. Therefore, the number of electrons accelerated to high speed increases, so the number of ionization reactions increases, and the electron density increases. With the increase of electrode spacing, the proportions of green and blue decrease, and the luminous color becomes darker. This is because with the increase of capacitance, the energy gain of a single electron remains unchanged; with the increase of electrode spacing, the energy gain of a single electron decreases. The energy gain of a single electron affects the energy difference between the upper and lower energy levels of the ionization excitation reaction. The higher the energy gain is, the greater the energy difference of the reaction is, and the shorter the wavelength of the spectral line corresponding to the reaction is. Therefore, the wavelengths of the spectral lines with the larger intensity increase when the capacitance is increased are shorter than the wavelengths of the spectral lines with the larger intensity increase when the spacing is increased. This can be observed in Figs. 3 and 4. When the capacitance is increased, the spectral lines with the larger intensity increase are roughly in the range of 500–600 nm, while, when the spacing is increased, the spectral lines with the larger intensity increase are roughly in the range of 580–660 nm. The CMF of red light in the range of 580–660 nm is relatively large, so when the spacing is increased, the composition of red light increases. Because it is a relative quantity, the result is that the proportions of blue and green light decrease, and the proportion of red light increases with the decrease of electron temperature and the increase of electron density.
From our examples, we can see that the luminous color becomes lighter with the increase of temperature, and the changing law of luminous color with electron density is affected by different changing working conditions, which affect the coordinates of data positions in the comparison diagram of luminous color, electron temperature, and electron density. Through the above research, the corresponding relationship of electron temperature, electron density data points, and luminous color is established and analyzed. From it, we can see that the method of obtaining plasma characteristics from luminous color is feasible. After increasing the amount of data, this method can be applied, which has great advantage for realizing high-speed plasma characterization.
5. Conclusion
In this paper, we propose a new optical analysis method to obtain the plasma characteristics through the plasma luminous color and apply this method to the high-speed miniaturized plasma synthesis jet actuator.
With the increase of electron temperature and electron density, the proportions of green and blue increase. This is related to the increase of spectral intensities in the wavelength range of 500–600 nm caused by the increase of electrons accelerated to high speed. With the decrease of electron temperature and the increase of electron density, the proportions of blue and green light decrease, and the proportion of red light increases. This is related to the increase of spectral intensities in the wavelength range of 580–660 nm. The luminous color becomes lighter with the increase of temperature, and the changing law of luminous color with electron density is different under the influence of different working conditions, which affect the coordinates of data points in the comparison diagram of luminescence color, electron temperature, and electron density.
The method of directly obtaining plasma characteristics from luminous color is feasible. To use this method, in the early stage, we need to calculate the luminous color and plasma characteristics from the spectral data and increase the amount of data. When using this method in the later stage, we will no longer need to collect the spectra, but directly query the database by color to obtain the plasma characteristics. This method has great advantages for realizing high-speed plasma characterization.
References
[1] J. Shin, V. Narayanaswamy, L. L. Raja, N. T. Clemens. Characterization of a direct-current glow discharge plasma actuator in low-pressure supersonic flow. AIAA J., 45, 1596(2007).
[2] V. Narayanaswamy, L. L. Raja, N. T. Clemens. Characterization of a high-frequency pulsed-plasma jet actuator for supersonic flow control. AIAA J., 48, 297(2010).
[3] N. Zhao, J. Li, Q. Ma, L. Guo, Q. Zhang. Periphery excitation of laser-induced CN fluorescence in plasma using laser-induced breakdown spectroscopy for carbon detection. Chin. Opt. Lett., 18, 083001(2020).
[4] A. Belinger, N. Naudé, J. P. Cambronne, D. Caruana. Plasma synthetic jet actuator: electrical and optical analysis of the discharge. J. Phys. D, 47, 345202(2014).
[5] K. Inoue, S. Takahashi, N. Sakakibara, S. Toko, T. Ito, K. Terashima. Spatiotemporal optical emission spectroscopy to estimate electron density and temperature of plasmas in solution. J. Phys. D, 53, 235202(2020).
[6] C. Pan. Diagnosis the physical characteristics of pulsed MIG welding arc by spectrum(2013).
[7] L. Min, X. Hao-jun, W. Xiao-long, L. Hua, S. Chen. Experimental study of generation and spectroscopic diagnosis of inductively coupled plasma in closed cavity. J. Air Force Eng. Univ., 16, 10(2015).
[8] L. Lei, X.-D. Chen, C.-X. Yuan, Z.-X. Zhou. Emission spectrum diagnose to Ar plasma jet. Chin. J. Lumin., 40, 1049(2019).
[9] C. J. Chen. Optical emission spectroscopic diagnosis on atmospheric-pressure pulse-modulated surface wave plasma and its characteristics(2019).
[10] M. Zhao, D. Zhang, L. Zheng, O. Condliffe, Y. Kang. Rapid quantitative detection of mineral oil contamination in vegetable oil by near-infrared spectroscopy. Chin. Opt. Lett., 18, 043001(2020).
[11] L. X. Liu, H. T. Huan, M. Andreas, X. P. Shao. Multiple dissolved gas analysis in transformer oil based on Fourier transform infrared photoacoustic spectroscopy. Spectrosc. Spectr. Anal., 40, 684(2020).
[12] A. Deng, Z. Zeng, J. Deng. VIPA-based two-component detection for a coherent population trapping experiment. Chin. Opt. Lett., 19, 083001(2021).
[13] J. Jo, J. Siddiqui, Y. Zhu, L. Ni, S.-R. Kothapalli, S. A. Tomlins, J. T. Wei, E. T. Keller, A. M. Udager, X. Wang, G. Xu. Photoacoustic spectral analysis at ultraviolet wavelengths for characterizing the Gleason grades of prostate cancer. Opt. Lett., 45, 6042(2020).
[14] Y. W. Chu, F. Chen, Y. Tang, T. Chen, Y. X. Yu, H. L. Jin, L. B. Guo, Y. F. Lu, X. Y. Zeng. Diagnosis of nasopharyngeal carcinoma from serum samples using hyperspectral imaging combined with a chemometric method. Opt. Express, 26, 28661(2018).
[15] K. Chen, Y. Qin, F. Zheng, M. Sun, D. Shi. Diagnosis of colorectal cancer using Raman spectroscopy of laser-trapped single living epithelial cells. Opt. Lett., 31, 2015(2006).
[16] C. Zhu, T. M. Breslin, J. Harter, N. Ramanujam. Model based and empirical spectral analysis for the diagnosis of breast cancer. Opt. Express, 16, 14961(2008).
[17] G. Chen, J. Zhu, X. Li. Influence of a dielectric decoupling layer on the local electric field and molecular spectroscopy in plasmonic nanocavities: a numerical study. Chin. Opt. Lett., 19, 123001(2021).
[18] Y. Z. Zhao, Y. L. Su, X. Y. Hou, M. H. Hong. Directional sliding of water: biomimetic snake scale surfaces. Opto-Electronic Adv., 4, 210008(2021).
[19] J. Li, J. Hu, J. Ma, X. Wen, D. Li. Identifying self-trapped excitons in 2D perovskites by Raman spectroscopy. Chin. Opt. Lett., 19, 103001(2021).
[20] M. Jia, H. Liang, H. Song, P. C. Liu, Y. Wu. Characteristic of spark discharge plasma jet driven by nanosecond pulses. High Volt. Eng., 37, 1493(2011).
[21] L. Wei, Z.-X. Wang, S. Li. Emission spectrum characteristics of nanosecond pulsed spark plasma. Adv. Electr. Electron. Eng., 35, 29(2016).
[22] Z. Yan. Novel plasma synthetic jet and its application in shock wave control(2018).
[23] A. Belinger. Plasma synthetic jet actuator: electrical and optical analysis of the discharge. J. Phys. D, 47, 345202(2014).


Set citation alerts for the article
Please enter your email address

© Copyright 2018-2021 | Chinese Laser Press. All Rights Reserved 沪ICP备15018463号-20