• Chinese Journal of Lasers
  • Vol. 45, Issue 12, 1211001 (2018)
Heng Zhao1、*, Yuxin Chen2, Xiaoding Xu1, and Bo Hu1
Author Affiliations
  • 1 School of Life Science and Technology, Xidian University, Xi'an, Shaanxi 710126, China
  • 2 School of Telecommunications Engineering, Xidian University, Xi'an, Shaanxi 710071, China
  • show less
    DOI: 10.3788/CJL201845.1211001 Cite this Article Set citation alerts
    Heng Zhao, Yuxin Chen, Xiaoding Xu, Bo Hu. Baseline Correction for Raman Spectra Based on Locally Symmetric Reweighted Penalized Least Squares[J]. Chinese Journal of Lasers, 2018, 45(12): 1211001 Copy Citation Text show less
    Schematic of softsign weighting function
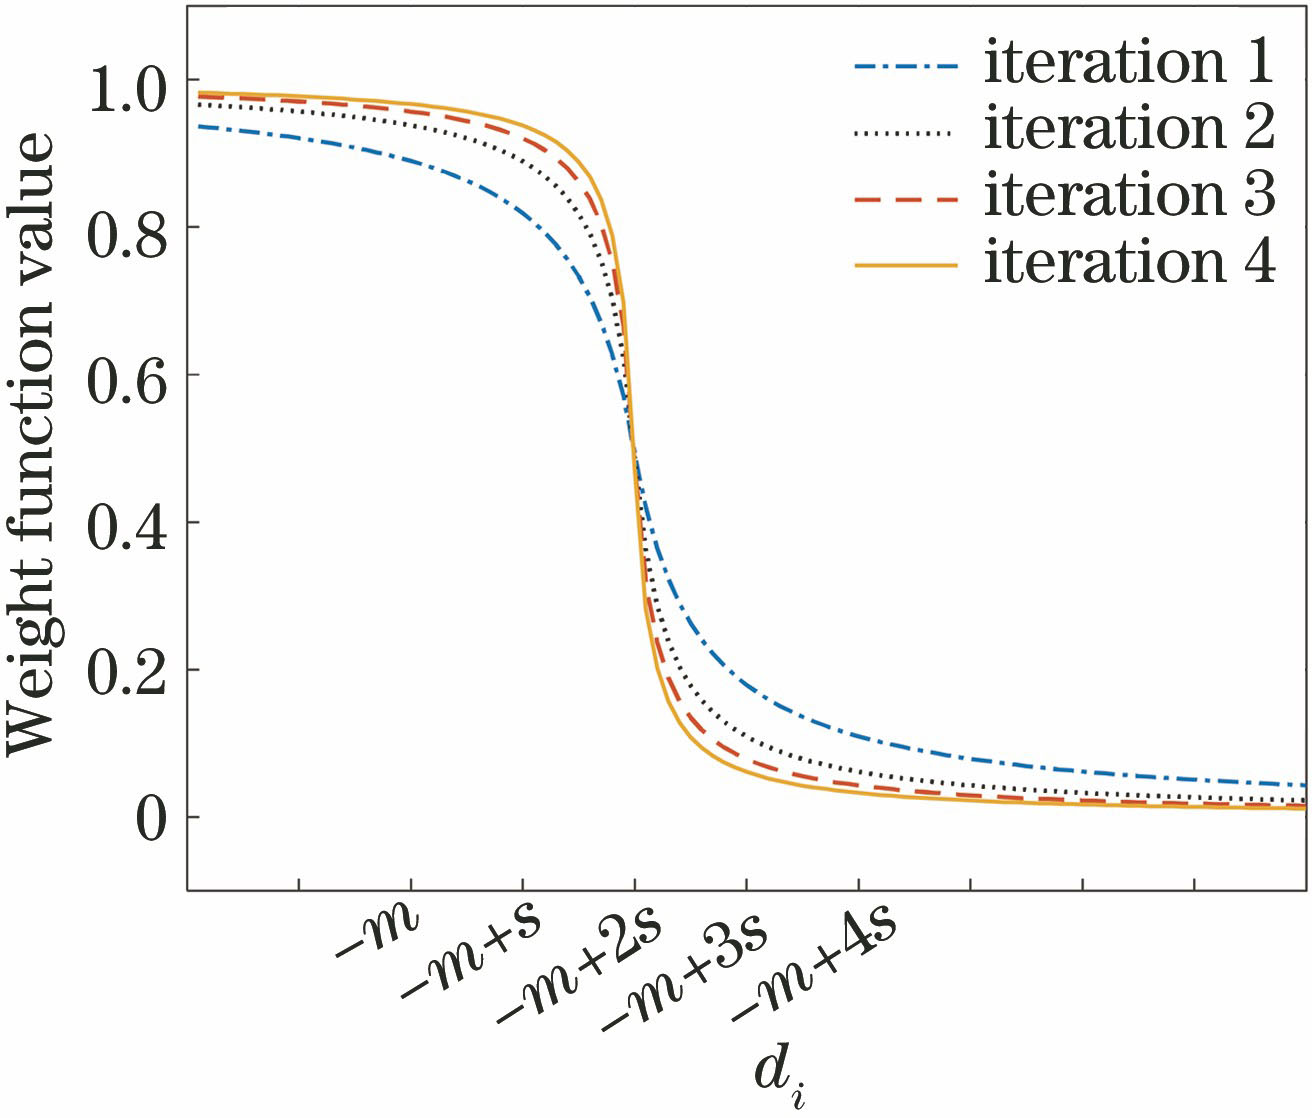
    Fig. 1. Schematic of softsign weighting function
    Flow chart of LSRPLS baseline correction algorithm
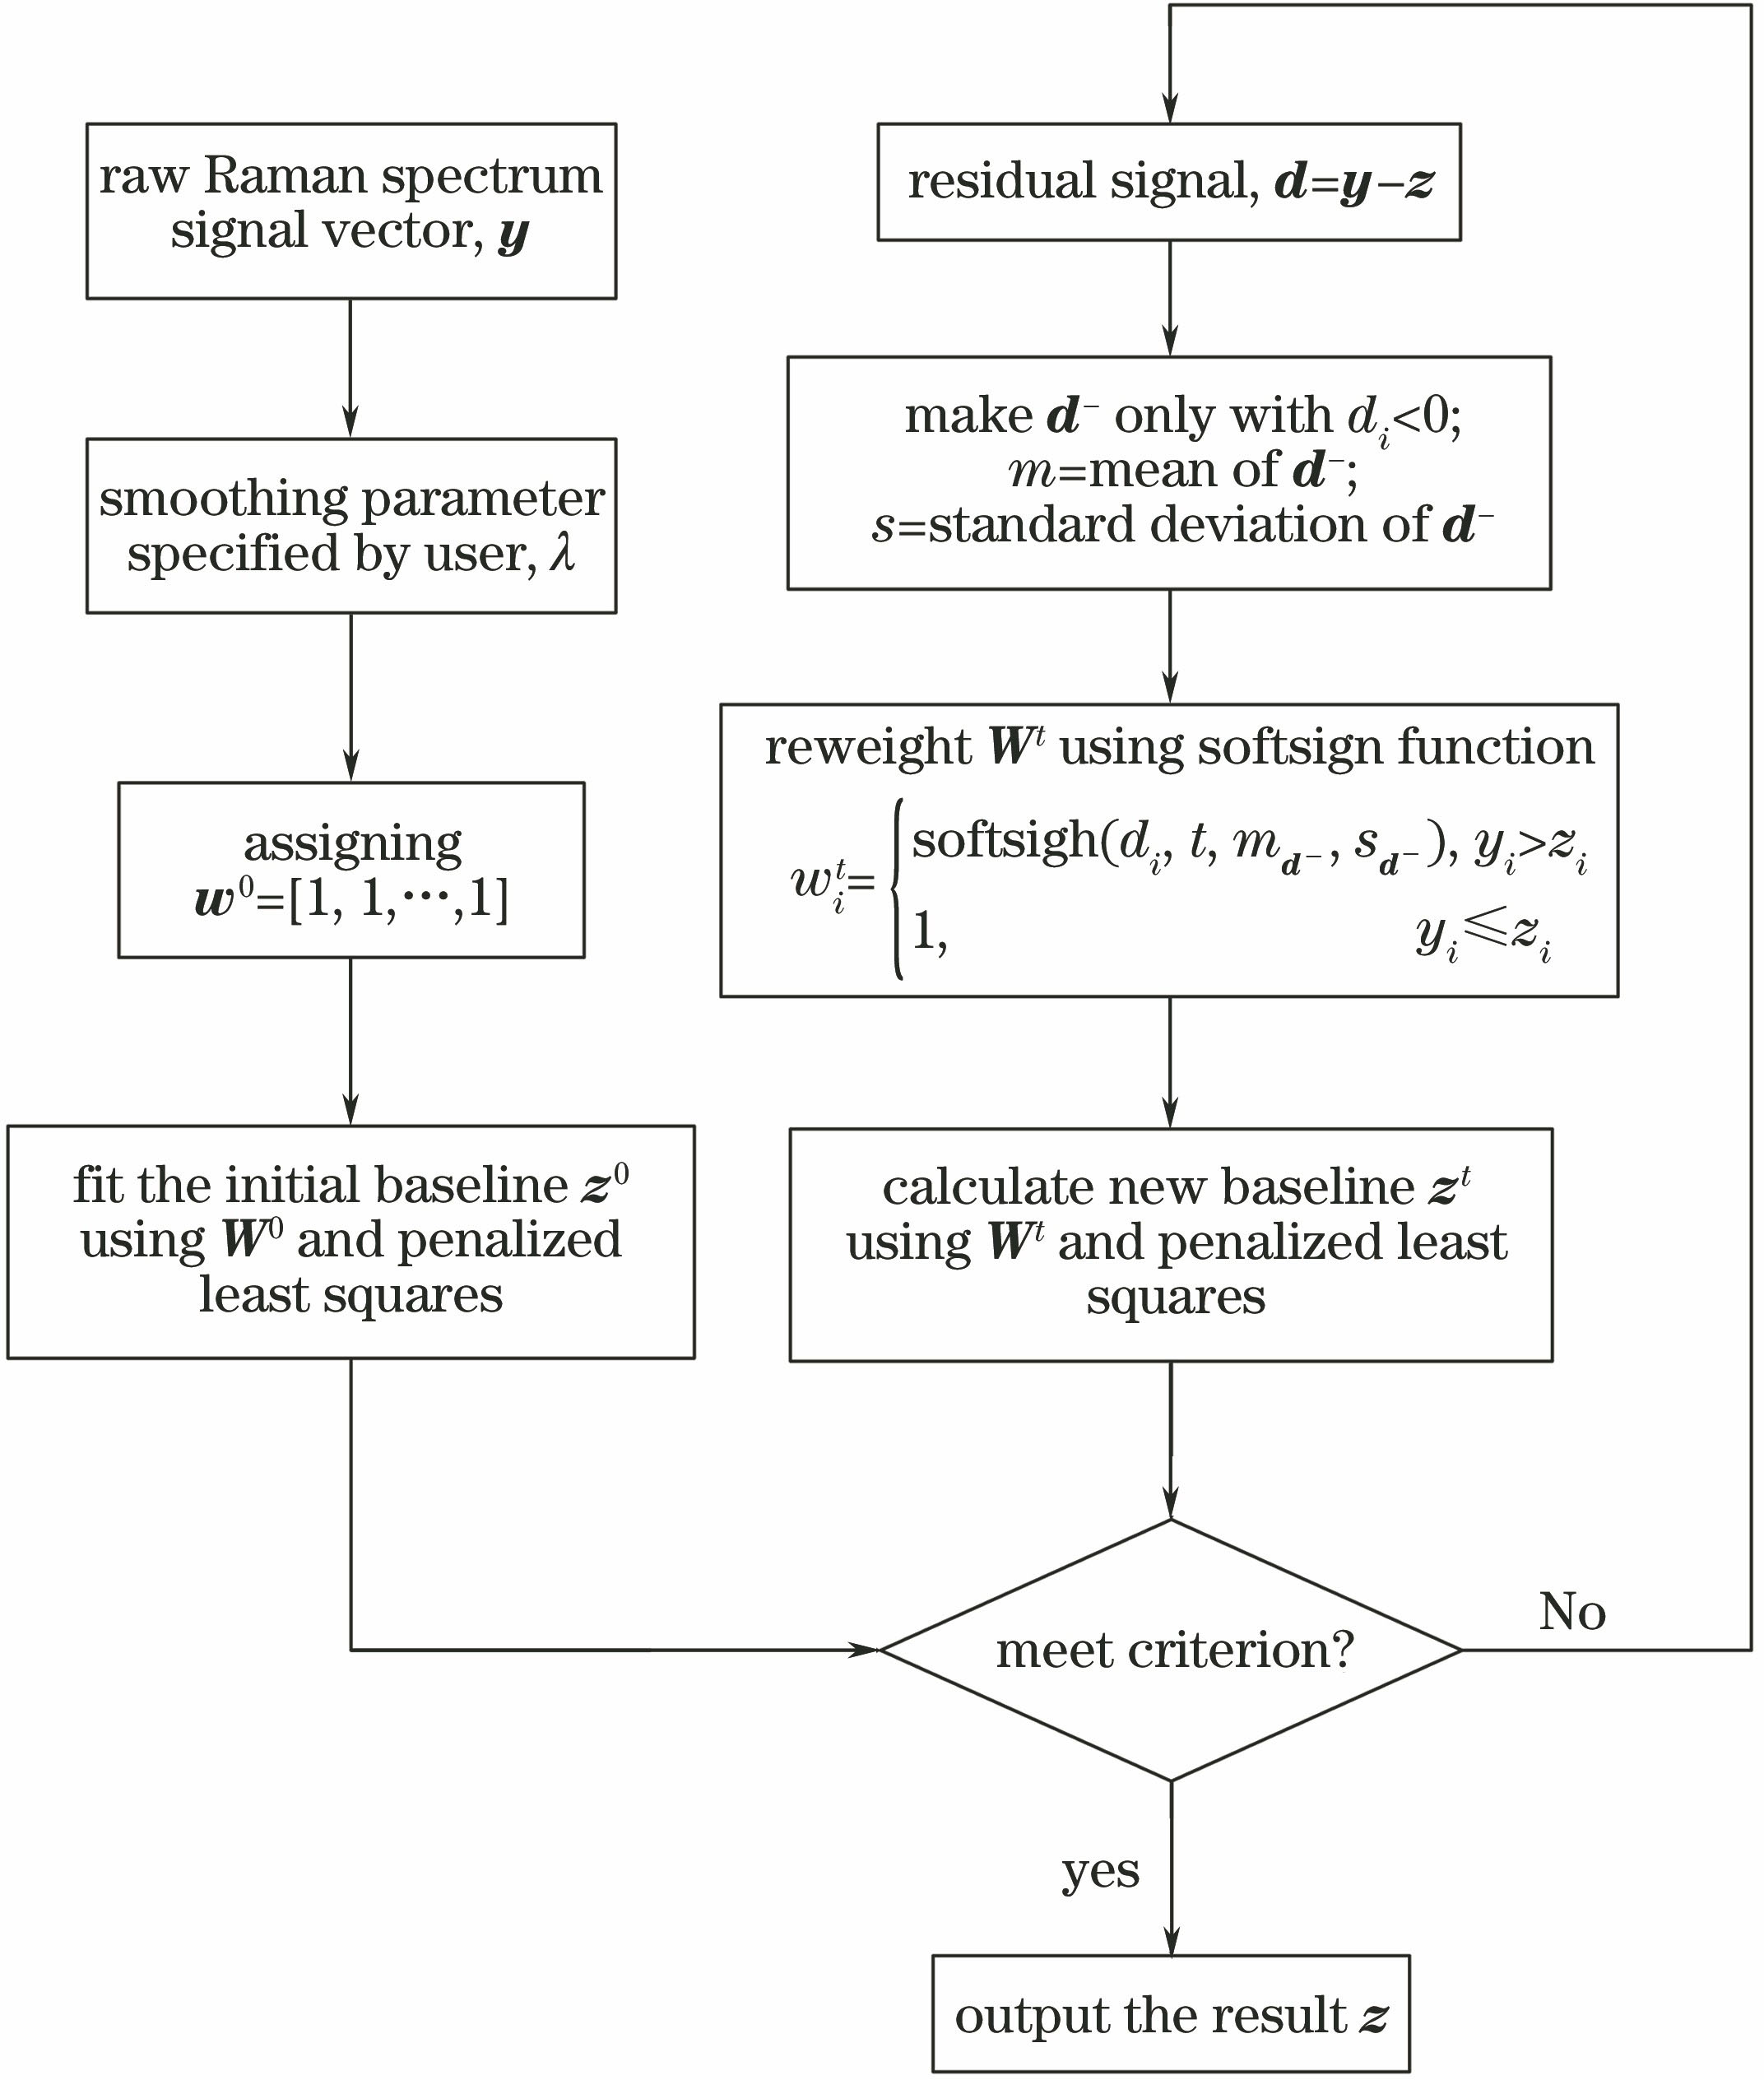
    Fig. 2. Flow chart of LSRPLS baseline correction algorithm
    Simulated Raman spectra with different types of baselines (signal to noise ratio of 15). (a) Linear baseline; (b) sinusoidal baseline; (c) Gaussian baseline; (d) exponential baseline
    Fig. 3. Simulated Raman spectra with different types of baselines (signal to noise ratio of 15). (a) Linear baseline; (b) sinusoidal baseline; (c) Gaussian baseline; (d) exponential baseline
    Spectrum correction results with combination baseline. (a) Root-mean-square error for various λ when signal to noise ratio is 15; (b) Raman spectra before and after baseline correction when signal to noise ratio is 15; (c) Raman spectra before and after baseline correction when signal to noise ratio is 20; (d) Raman spectra before and after baseline correction when signal to noise ratio is 30
    Fig. 4. Spectrum correction results with combination baseline. (a) Root-mean-square error for various λ when signal to noise ratio is 15; (b) Raman spectra before and after baseline correction when signal to noise ratio is 15; (c) Raman spectra before and after baseline correction when signal to noise ratio is 20; (d) Raman spectra before and after baseline correction when signal to noise ratio is 30
    Experimental results of simulated Raman spectra. (a) Estimated error curves for linear baseline; (b) estimated error curves for sinusoidal baseline; (c) estimated error curves for Gaussian baseline; (d) estimated error curves for exponential baseline; (e) vertically enlarged error curves for Gaussian baseline; (f) vertically enlarged error curves for exponential baseline
    Fig. 5. Experimental results of simulated Raman spectra. (a) Estimated error curves for linear baseline; (b) estimated error curves for sinusoidal baseline; (c) estimated error curves for Gaussian baseline; (d) estimated error curves for exponential baseline; (e) vertically enlarged error curves for Gaussian baseline; (f) vertically enlarged error curves for exponential baseline
    SERS spectra estimated baselines and correction results of R6G. (a) Original R6G Raman spectrum and estimated baselines with different correction algorithms; (b) baseline correction result using LSRPLS algorithm
    Fig. 6. SERS spectra estimated baselines and correction results of R6G. (a) Original R6G Raman spectrum and estimated baselines with different correction algorithms; (b) baseline correction result using LSRPLS algorithm
    SERS spectra of two samples before and after baseline correction. (a) Original spectra of 4-MBA; (b) corrected spectra of 4-MBA; (c) original spectra of 4-MPY; (d) corrected spectra of 4-MPY
    Fig. 7. SERS spectra of two samples before and after baseline correction. (a) Original spectra of 4-MBA; (b) corrected spectra of 4-MBA; (c) original spectra of 4-MPY; (d) corrected spectra of 4-MPY
    Plots of PCA scores for Raman spectra of two samples. (a) PCA score of original Raman spectra; (b) PCA score of baseline corrected spectra
    Fig. 8. Plots of PCA scores for Raman spectra of two samples. (a) PCA score of original Raman spectra; (b) PCA score of baseline corrected spectra
    Baseline functionIndexPeak number
    12345
    LinearEstimated PH211.54309.38187.50157.72223.91
    Peak error-0.95-4.26-2.058.21-1.03
    SinusoidalEstimated PH209.27307.16180.15163.47221.13
    Peak error1.32-2.045.302.471.76
    GaussianEstimated PH203.33295.17186.00160.90210.04
    Peak error7.269.95-0.555.0412.84
    ExponentialEstimated PH194.16300.85184.19160.89211.38
    Peak error16.434.261.255.0511.50
    CombinationEstimated PH202.81303.99185.23158.39209.92
    Peak error7.781.120.217.5412.97
    Actual PH210.59305.12185.45165.94222.88
    Table 1. Comparison of peak heights before and after simulated spectrum baseline correction
    MethodMean root-mean-square error
    LinearSinusoidalGaussianExponentialCombination
    AdaptMinmax13.663412.712667.944231.200360.9522
    ModPoly15.473515.324815.590915.230415.4193
    AsLS13.409113.404513.439314.663714.4587
    airPLS5.16727.81648.851814.186710.9666
    MPLS7.55538.24728.329721.236914.6842
    LSRPLS2.68083.66507.093310.992811.2270
    Table 2. Mean root-mean-square error using different baseline correction methods
    True classCross-validationTest
    4-MBA4-MPY4-MBA4-MPY
    Assigned class4-MBA228164
    4-MPY624119
    Raw spectrumSensitivity /%73808095
    Specificity /%80739580
    RCC /%7788
    Assigned class4-MBA3020
    4-MPY3020
    PretreatmentSensitivity /%100100100100
    Specificity /%100100100100
    RCC /%100100
    Table 3. Classification results for 4-MBA and 4-MPY by PCA-LDA
    Heng Zhao, Yuxin Chen, Xiaoding Xu, Bo Hu. Baseline Correction for Raman Spectra Based on Locally Symmetric Reweighted Penalized Least Squares[J]. Chinese Journal of Lasers, 2018, 45(12): 1211001
    Download Citation