• Chinese Physics B
  • Vol. 29, Issue 9, (2020)
Yan Chao1、2, Liqing Xu1、†, Liqun Hu1, Yanmin Duan1, Tianbo Wang3, Yi Yuan1、2, and Yongkuan Zhang1、2
Author Affiliations
  • 1Institute of Plasma Physics, Hefei Institutes of Physical Science, Chinese Academy of Sciences, Hefei 23003, China
  • 2University of Science and Technology of China, Hefei 3006, China
  • 3Southwestern Institute for Physics, CNNC, Chengdu 610200, China
  • show less
    DOI: 10.1088/1674-1056/aba2e4 Cite this Article
    Yan Chao, Liqing Xu, Liqun Hu, Yanmin Duan, Tianbo Wang, Yi Yuan, Yongkuan Zhang. Gaussian process tomography based on Bayesian data analysis for soft x-ray and AXUV diagnostics on EAST[J]. Chinese Physics B, 2020, 29(9): Copy Citation Text show less
    Illustration of lines-of-sight distribution (a) before 2019 and (b) since 2019 of the SXR cameras in an upper-single null configuration on EAST. The green curve indicates the position of the last-closed flux surface. SXR1-46D(U) and SXR1-30V are signals corresponding to the lines of sight.
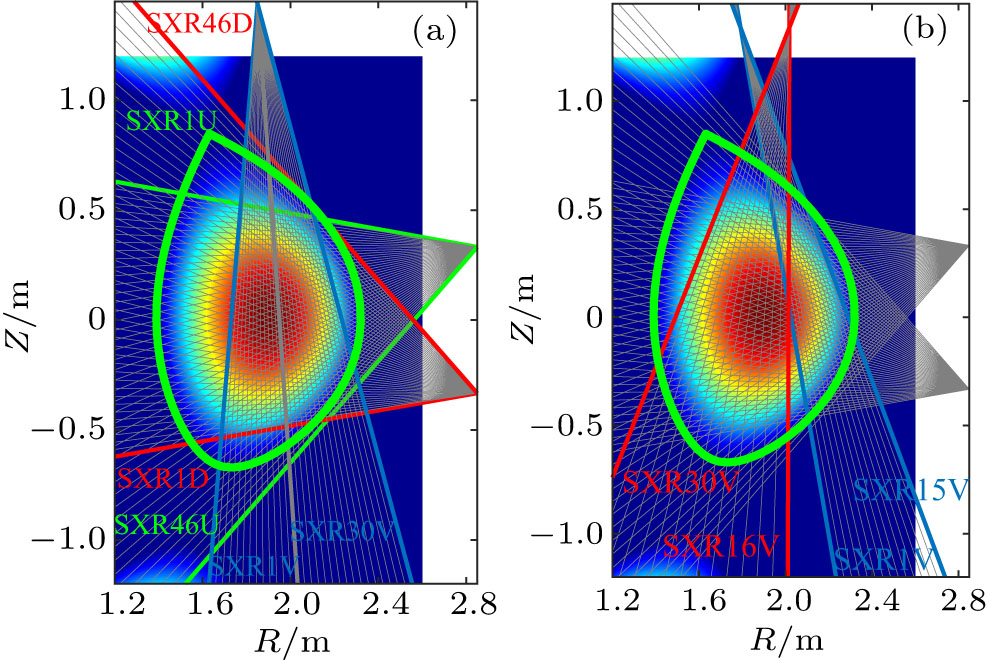
    Fig. 1. Illustration of lines-of-sight distribution (a) before 2019 and (b) since 2019 of the SXR cameras in an upper-single null configuration on EAST. The green curve indicates the position of the last-closed flux surface. SXR1-46D(U) and SXR1-30V are signals corresponding to the lines of sight.
    Employing GPT to SXR data in EAST discharge #70754 during sawtooth ramp-up. Top panel: the time evolution of SXR channel #23. Low panels from (A) to (F): SXR tomographic reconstructions corresponding to the 6 time slices marked in the top panel. The unit a.u. is short for arbitrary units.
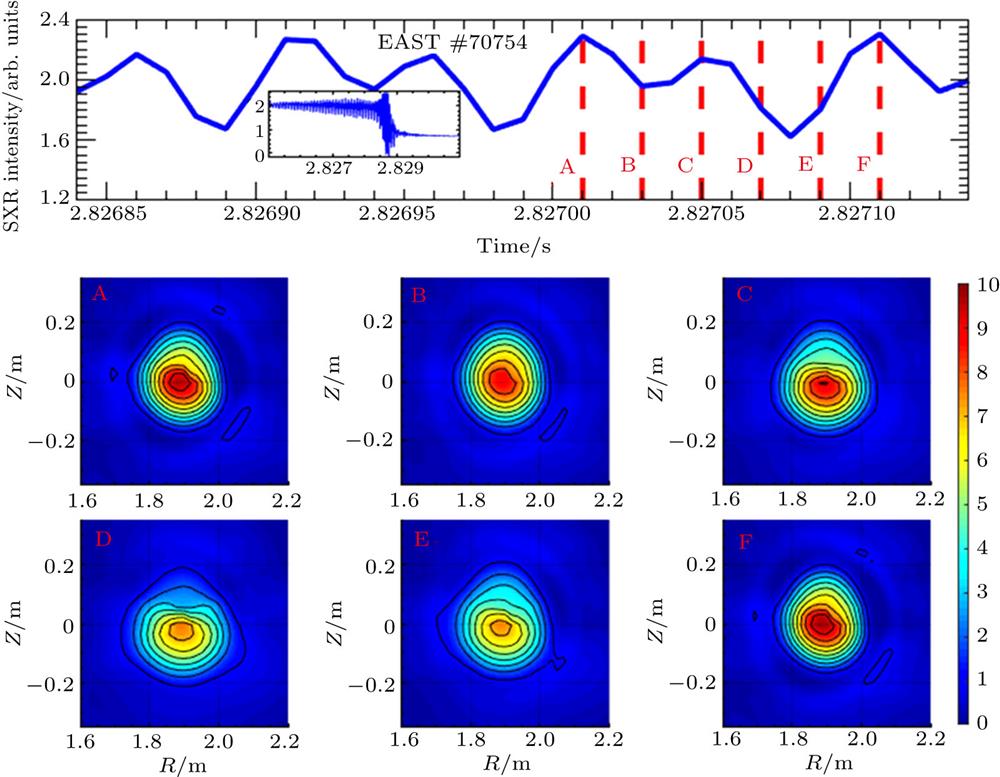
    Fig. 2. Employing GPT to SXR data in EAST discharge #70754 during sawtooth ramp-up. Top panel: the time evolution of SXR channel #23. Low panels from (A) to (F): SXR tomographic reconstructions corresponding to the 6 time slices marked in the top panel. The unit a.u. is short for arbitrary units.
    Employing GPT to SXR data in EAST discharge #70754 during sawtooth crash phase. Top panel: the time evolution of SXR channel #23. Low panels from (A) to (F): SXR tomographic reconstructions corresponding to the 6 time slices marked in the top panel.
    Fig. 3. Employing GPT to SXR data in EAST discharge #70754 during sawtooth crash phase. Top panel: the time evolution of SXR channel #23. Low panels from (A) to (F): SXR tomographic reconstructions corresponding to the 6 time slices marked in the top panel.
    SVD analysis of the kink mode. The first three topos are given: (a) the first topos; (b) the second topos and the 1/1 mode structure; (c) the third topos.
    Fig. 4. SVD analysis of the kink mode. The first three topos are given: (a) the first topos; (b) the second topos and the 1/1 mode structure; (c) the third topos.
    Tomographic reconstructions at t = 2.8284 s during shot #70754: (a) reconstructed SXR emissivity; (b) reconstructed SXR emissivity gradient; (c) covariance of the reconstructed emissivity; (d) comparison of the tomography results to the measurements.
    Fig. 5. Tomographic reconstructions at t = 2.8284 s during shot #70754: (a) reconstructed SXR emissivity; (b) reconstructed SXR emissivity gradient; (c) covariance of the reconstructed emissivity; (d) comparison of the tomography results to the measurements.
    Experimental traces of shot #70754 (red lines) and shot #61450 (blue lines) in EAST: (a) core soft-x-ray intensity; (b) line-averaged electron density; (c) plasma current. Ne is the electron density, Ip is plasma current.
    Fig. 6. Experimental traces of shot #70754 (red lines) and shot #61450 (blue lines) in EAST: (a) core soft-x-ray intensity; (b) line-averaged electron density; (c) plasma current. Ne is the electron density, Ip is plasma current.
    Application of GPT to SXR data in EAST discharge #61450 during a sawtooth-like disruption precursor and crash phase. Top panel: the evolution of SXR radiation. Low panels from (A) to (J): SXR tomographic reconstructions corresponding to the 10 time slices marked in top panel.
    Fig. 7. Application of GPT to SXR data in EAST discharge #61450 during a sawtooth-like disruption precursor and crash phase. Top panel: the evolution of SXR radiation. Low panels from (A) to (J): SXR tomographic reconstructions corresponding to the 10 time slices marked in top panel.
    (a) The evolution of the perturbation SXR signal distribution. (b) The evolution of the toroidal mode number acquired from Mirnov signals.
    Fig. 8. (a) The evolution of the perturbation SXR signal distribution. (b) The evolution of the toroidal mode number acquired from Mirnov signals.
    Tomographic reconstructions at t = 3.75 s during shot #61450: (a) reconstructed SXR emissivity; (b) reconstructed SXR emissivity gradient; (c) covariance of the reconstructed emissivity; (d) comparison of the topographies to the measurements.
    Fig. 9. Tomographic reconstructions at t = 3.75 s during shot #61450: (a) reconstructed SXR emissivity; (b) reconstructed SXR emissivity gradient; (c) covariance of the reconstructed emissivity; (d) comparison of the topographies to the measurements.
    Illustration of the lines-of-sight distribution of the AXUV cameras in upper-single null configuration in EAST (a) before 2019 and (b) since 2019. The green curve indicates the position of the last-closed flux surface. The PXUV1-64 and CXUV1-40 are signals corresponding to the lines of sight.
    Fig. 10. Illustration of the lines-of-sight distribution of the AXUV cameras in upper-single null configuration in EAST (a) before 2019 and (b) since 2019. The green curve indicates the position of the last-closed flux surface. The PXUV1-64 and CXUV1-40 are signals corresponding to the lines of sight.
    Top panels from (A) to (E): AXUV tomographic reconstructions of EAST discharge #63720 corresponding to the 5 time slices marked in the low panel. Low panel: (a) lower divertor radiation (black line), core radiation (red line) and upper boundary radiation (blue line); (b) molybdenum concentration in the plasma core; (c) line-averaged electron density (black line) and plasma energy storage (blue line). M0 is molybolenum concentration signal. Wmhd is the plasma energy storage signal.
    Fig. 11. Top panels from (A) to (E): AXUV tomographic reconstructions of EAST discharge #63720 corresponding to the 5 time slices marked in the low panel. Low panel: (a) lower divertor radiation (black line), core radiation (red line) and upper boundary radiation (blue line); (b) molybdenum concentration in the plasma core; (c) line-averaged electron density (black line) and plasma energy storage (blue line). M0 is molybolenum concentration signal. Wmhd is the plasma energy storage signal.
    (a) AXUV contour plot of EAST discharge #63720. (b) The intensity of Dα signal. Dα is the α Balmer emission line of deuterium.
    Fig. 12. (a) AXUV contour plot of EAST discharge #63720. (b) The intensity of Dα signal. Dα is the α Balmer emission line of deuterium.
    Plasma parameters during EAST discharge #69042: (a) plasma current; (b) line-averaged electron density; (c) plasma energy storage; (d) lower divertor radiation (black line), core radiation (red line), and upper boundary radiation (blue line); (e) tungsten concentration at the plasma core (red line) and intensity of Mirnov signal (blue line); (f) the radiation of neon gas. The wuta & cmp1t are tungsten concentration and magnetic perturbation respectively.
    Fig. 13. Plasma parameters during EAST discharge #69042: (a) plasma current; (b) line-averaged electron density; (c) plasma energy storage; (d) lower divertor radiation (black line), core radiation (red line), and upper boundary radiation (blue line); (e) tungsten concentration at the plasma core (red line) and intensity of Mirnov signal (blue line); (f) the radiation of neon gas. The wuta & cmp1t are tungsten concentration and magnetic perturbation respectively.
    (a) AXUV contour plot of EAST discharge #69042; (b) line-averaged electron density; (c) plasma energy storage; (d) the intensity of the Mirnov signal.
    Fig. 14. (a) AXUV contour plot of EAST discharge #69042; (b) line-averaged electron density; (c) plasma energy storage; (d) the intensity of the Mirnov signal.
    Top panels from (A) to (E): AXUV tomographic reconstructions of EAST discharge #69042 corresponding to the 5 time slices marked in the low panel. Low panel: (a) lower divertor radiation (black line), core radiation (red line), and upper boundary radiation (blue line); (b) tungsten concentration at the plasma core; (c) neon gas radiation.
    Fig. 15. Top panels from (A) to (E): AXUV tomographic reconstructions of EAST discharge #69042 corresponding to the 5 time slices marked in the low panel. Low panel: (a) lower divertor radiation (black line), core radiation (red line), and upper boundary radiation (blue line); (b) tungsten concentration at the plasma core; (c) neon gas radiation.
    (a) Electron temperature profile and (b) electron density profile during EAST discharge #69042.
    Fig. 16. (a) Electron temperature profile and (b) electron density profile during EAST discharge #69042.
    SVD results of the SXR intensity before (red line) and after (black line) gas-puffing; (a) weight factor of the m = 1 mode and m = 2 mode; (b) first topo of SVD; (c) second topo of SVD.
    Fig. 17. SVD results of the SXR intensity before (red line) and after (black line) gas-puffing; (a) weight factor of the m = 1 mode and m = 2 mode; (b) first topo of SVD; (c) second topo of SVD.
    Yan Chao, Liqing Xu, Liqun Hu, Yanmin Duan, Tianbo Wang, Yi Yuan, Yongkuan Zhang. Gaussian process tomography based on Bayesian data analysis for soft x-ray and AXUV diagnostics on EAST[J]. Chinese Physics B, 2020, 29(9):
    Download Citation