
Wei Liu, Jiaxin Song, Pengfei Ma, Hu Xiao, Pu Zhou. Effects of background spectral noise in the phase-modulated single-frequency seed laser on high-power narrow-linewidth fiber amplifiers[J]. Photonics Research, 2021, 9(4): 424
- Photonics Research
- Vol. 9, Issue 4, 424 (2021)
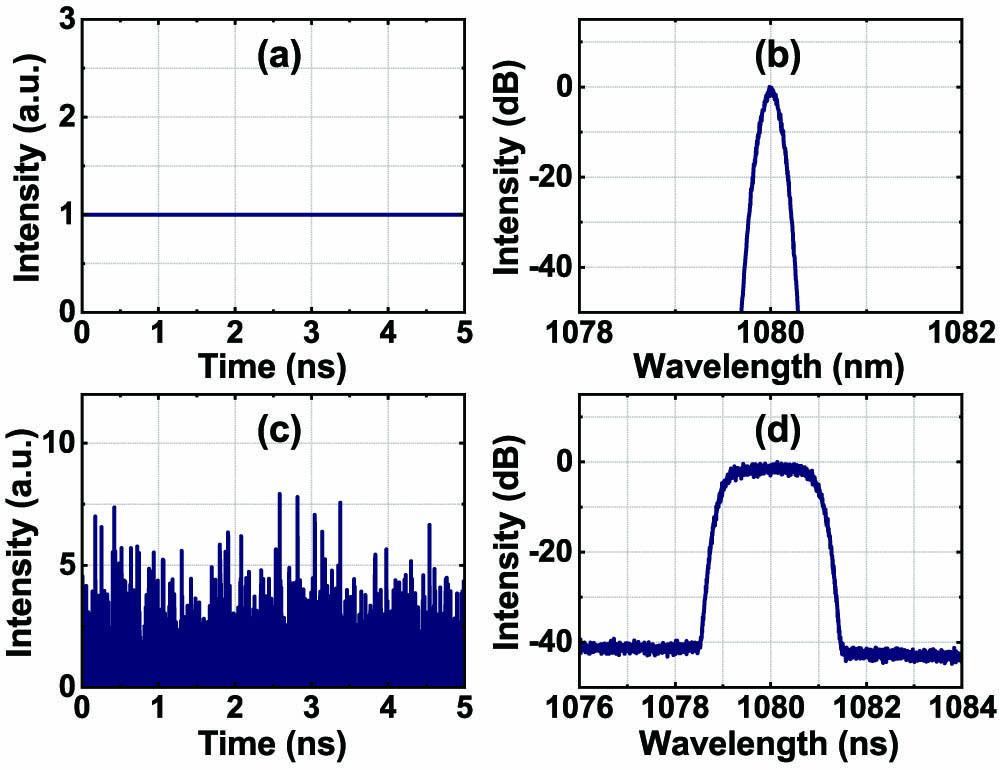
Fig. 1. Normalized temporal and spectral intensity of the constructed phase-modulated single-frequency part (first line) and background spectral noise (second line): (a), (c) normalized temporal intensity; (b), (d) normalized spectral intensity.
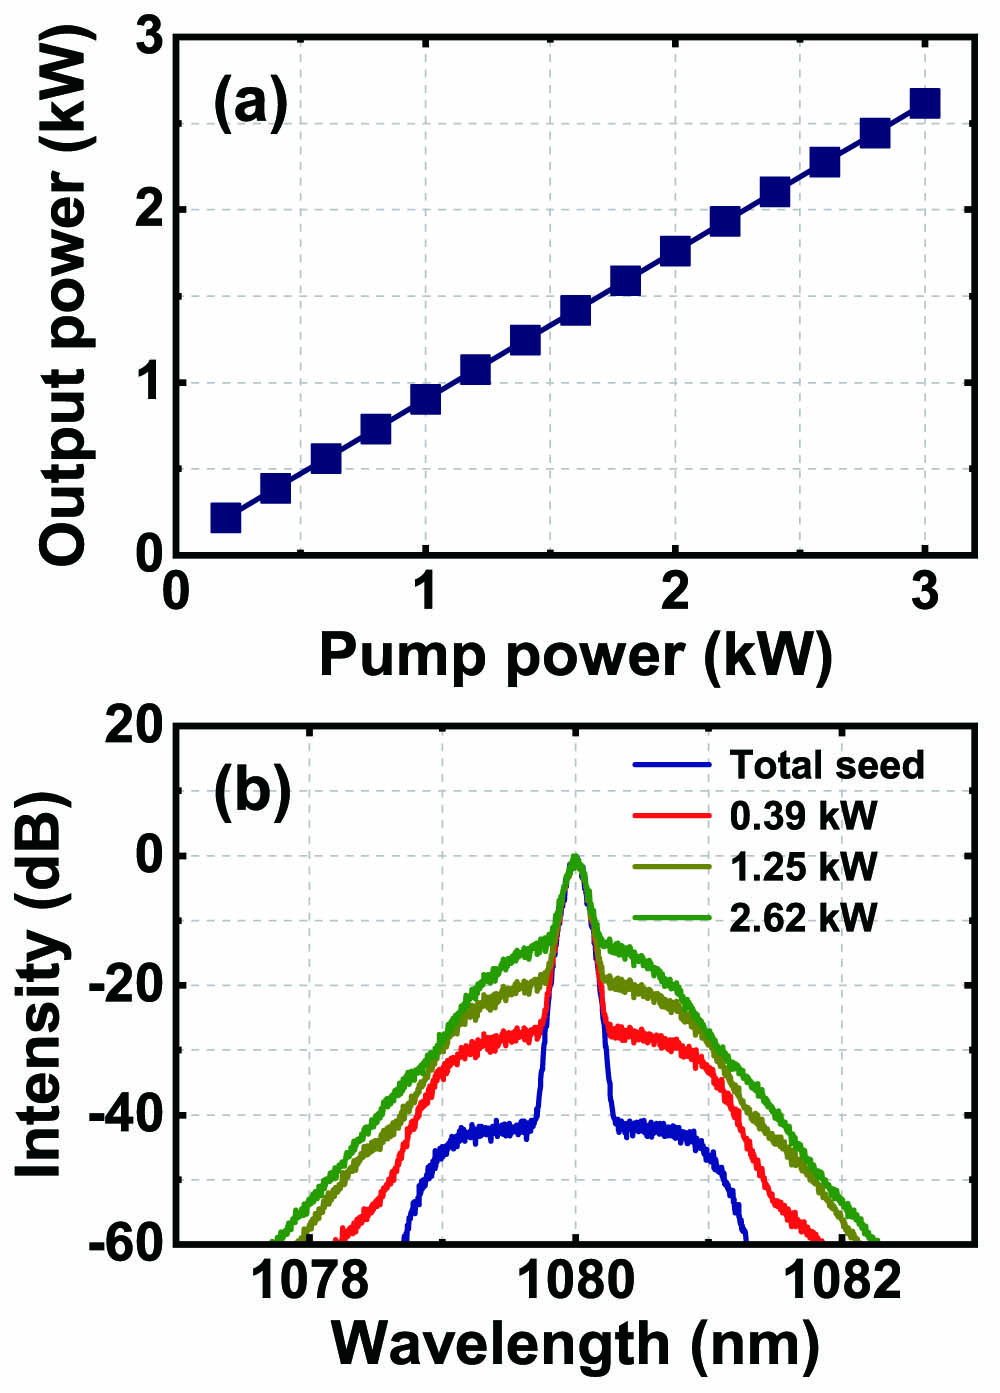
Fig. 2. Output powers and spectra of the total signal laser at different pump powers: (a) output power; (b) output spectra.
Fig. 3. Power-ratio spectral linewidths of total signal laser at different output powers.
Fig. 4. Power evolutions of the two spectral components along the fiber amplifier.
Fig. 5. Normalized spectral evolutions along the fiber amplifier: (a) the phase-modulated single-frequency part; (b) the background spectral noise.
Fig. 6. Output spectrum of the total signal laser at a pump power of 2 kW when ignoring FWM terms in the simulation.
Fig. 7. Power-ratio spectral linewidths of the total signal laser at a pump power of 2 kW when the power ratio or the bandwidth of the background spectral noise is different: (a) the power ratio is different; (b) the bandwidth is different.
Fig. 8. Power-ratio spectral linewidths of the total signal laser at a pump power of 2 kW when the power ratio of the backward pump power is different.
Fig. 9. Experimental setup of the fiber amplifier.
Fig. 10. Normalized measured and simulated spectra of the fiber amplifier at different output powers: (a) seed laser; (b) 0.48 kW; (c) 0.99 kW; (d) 1.51 kW.
Fig. 11. Ninety-nine percent power-ratio spectral linewidths of the total signal laser at different output powers when the experimental setups are different.
|
Table 1. Major Simulation Parameters for the Fiber Amplifier

Set citation alerts for the article
Please enter your email address
© Copyright 2018-2021 | Chinese Laser Press. All Rights Reserved 沪ICP备15018463号-20