
Zhiyu Li, Hao Li, Hefei Cao, Mengzhe Jin, Man Hu. Time-domain measurement of the transient electric field caused by pantograph-catenary off-line discharge based on D-dot Sensor[J]. High Power Laser and Particle Beams, 2022, 34(12): 123001
- High Power Laser and Particle Beams
- Vol. 34, Issue 12, 123001 (2022)
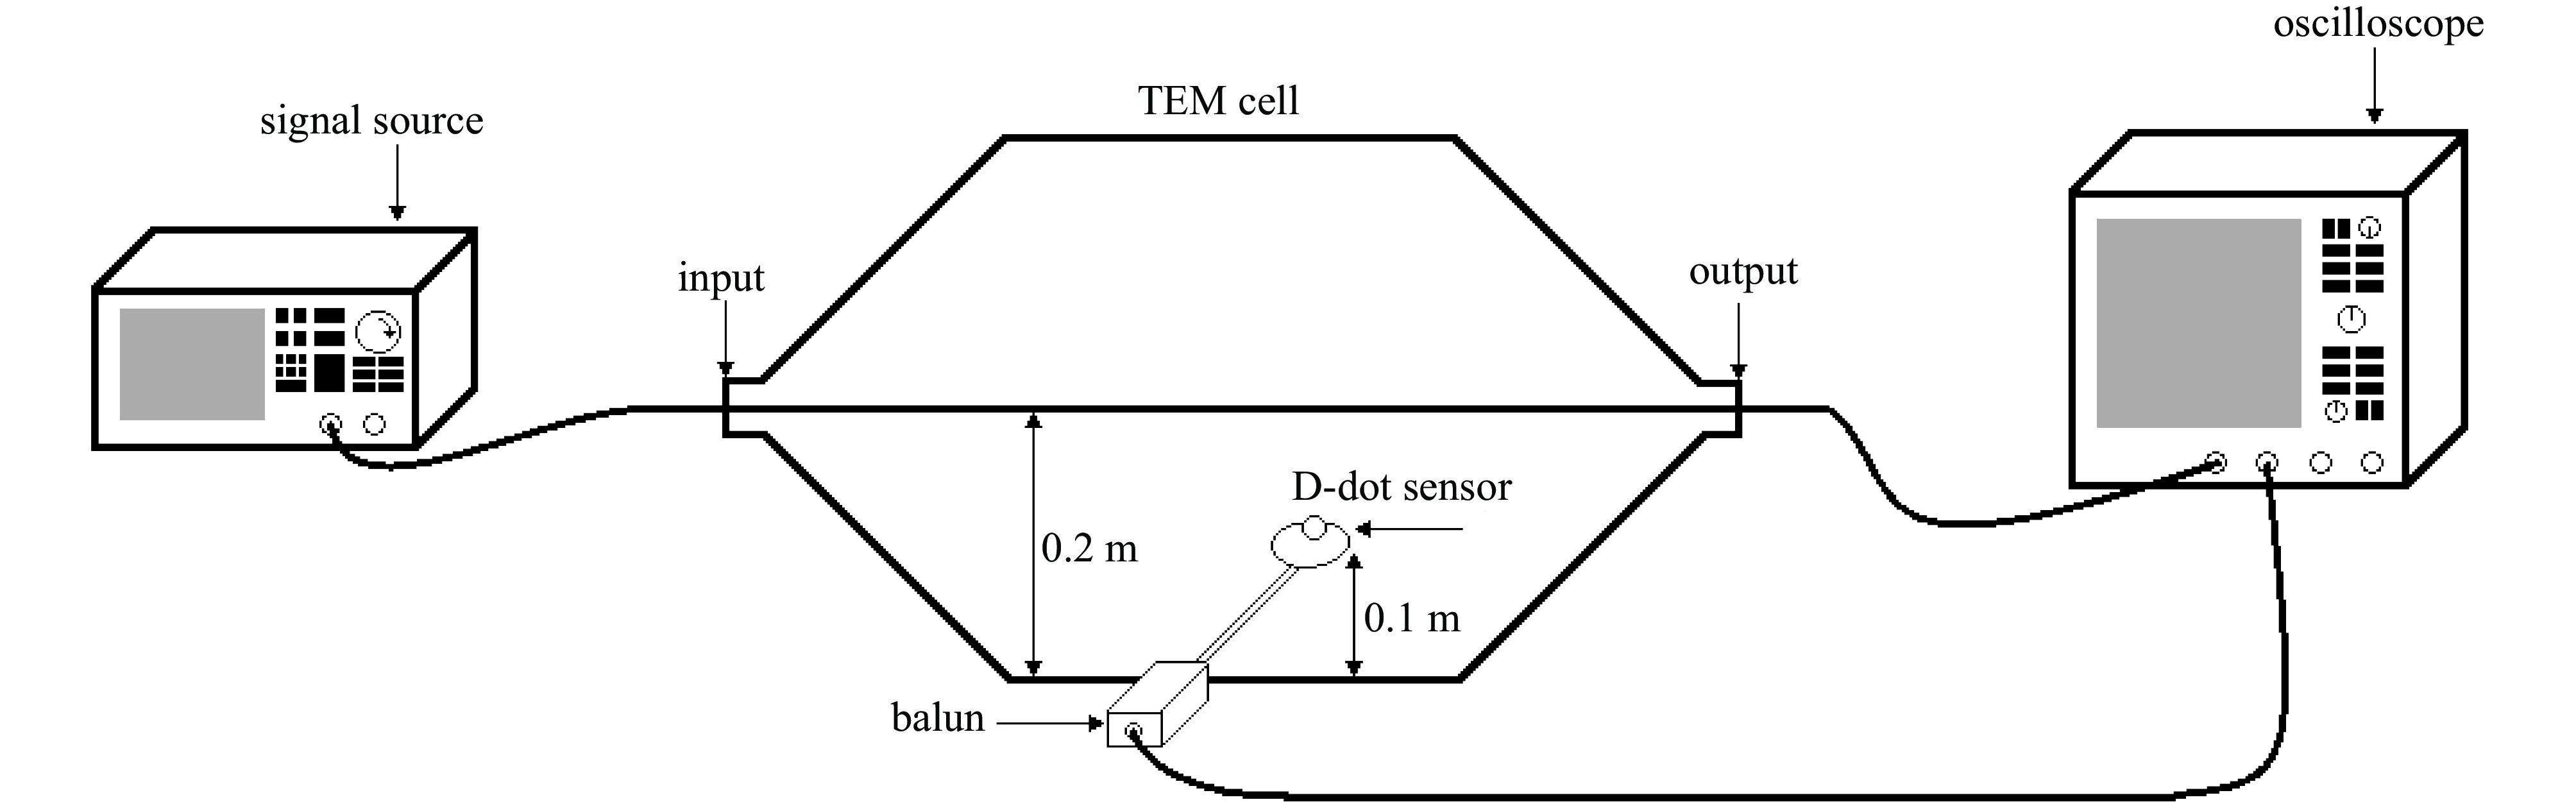
Fig. 1. Schematic diagram of the structure of the transient electric field waveform restoration system
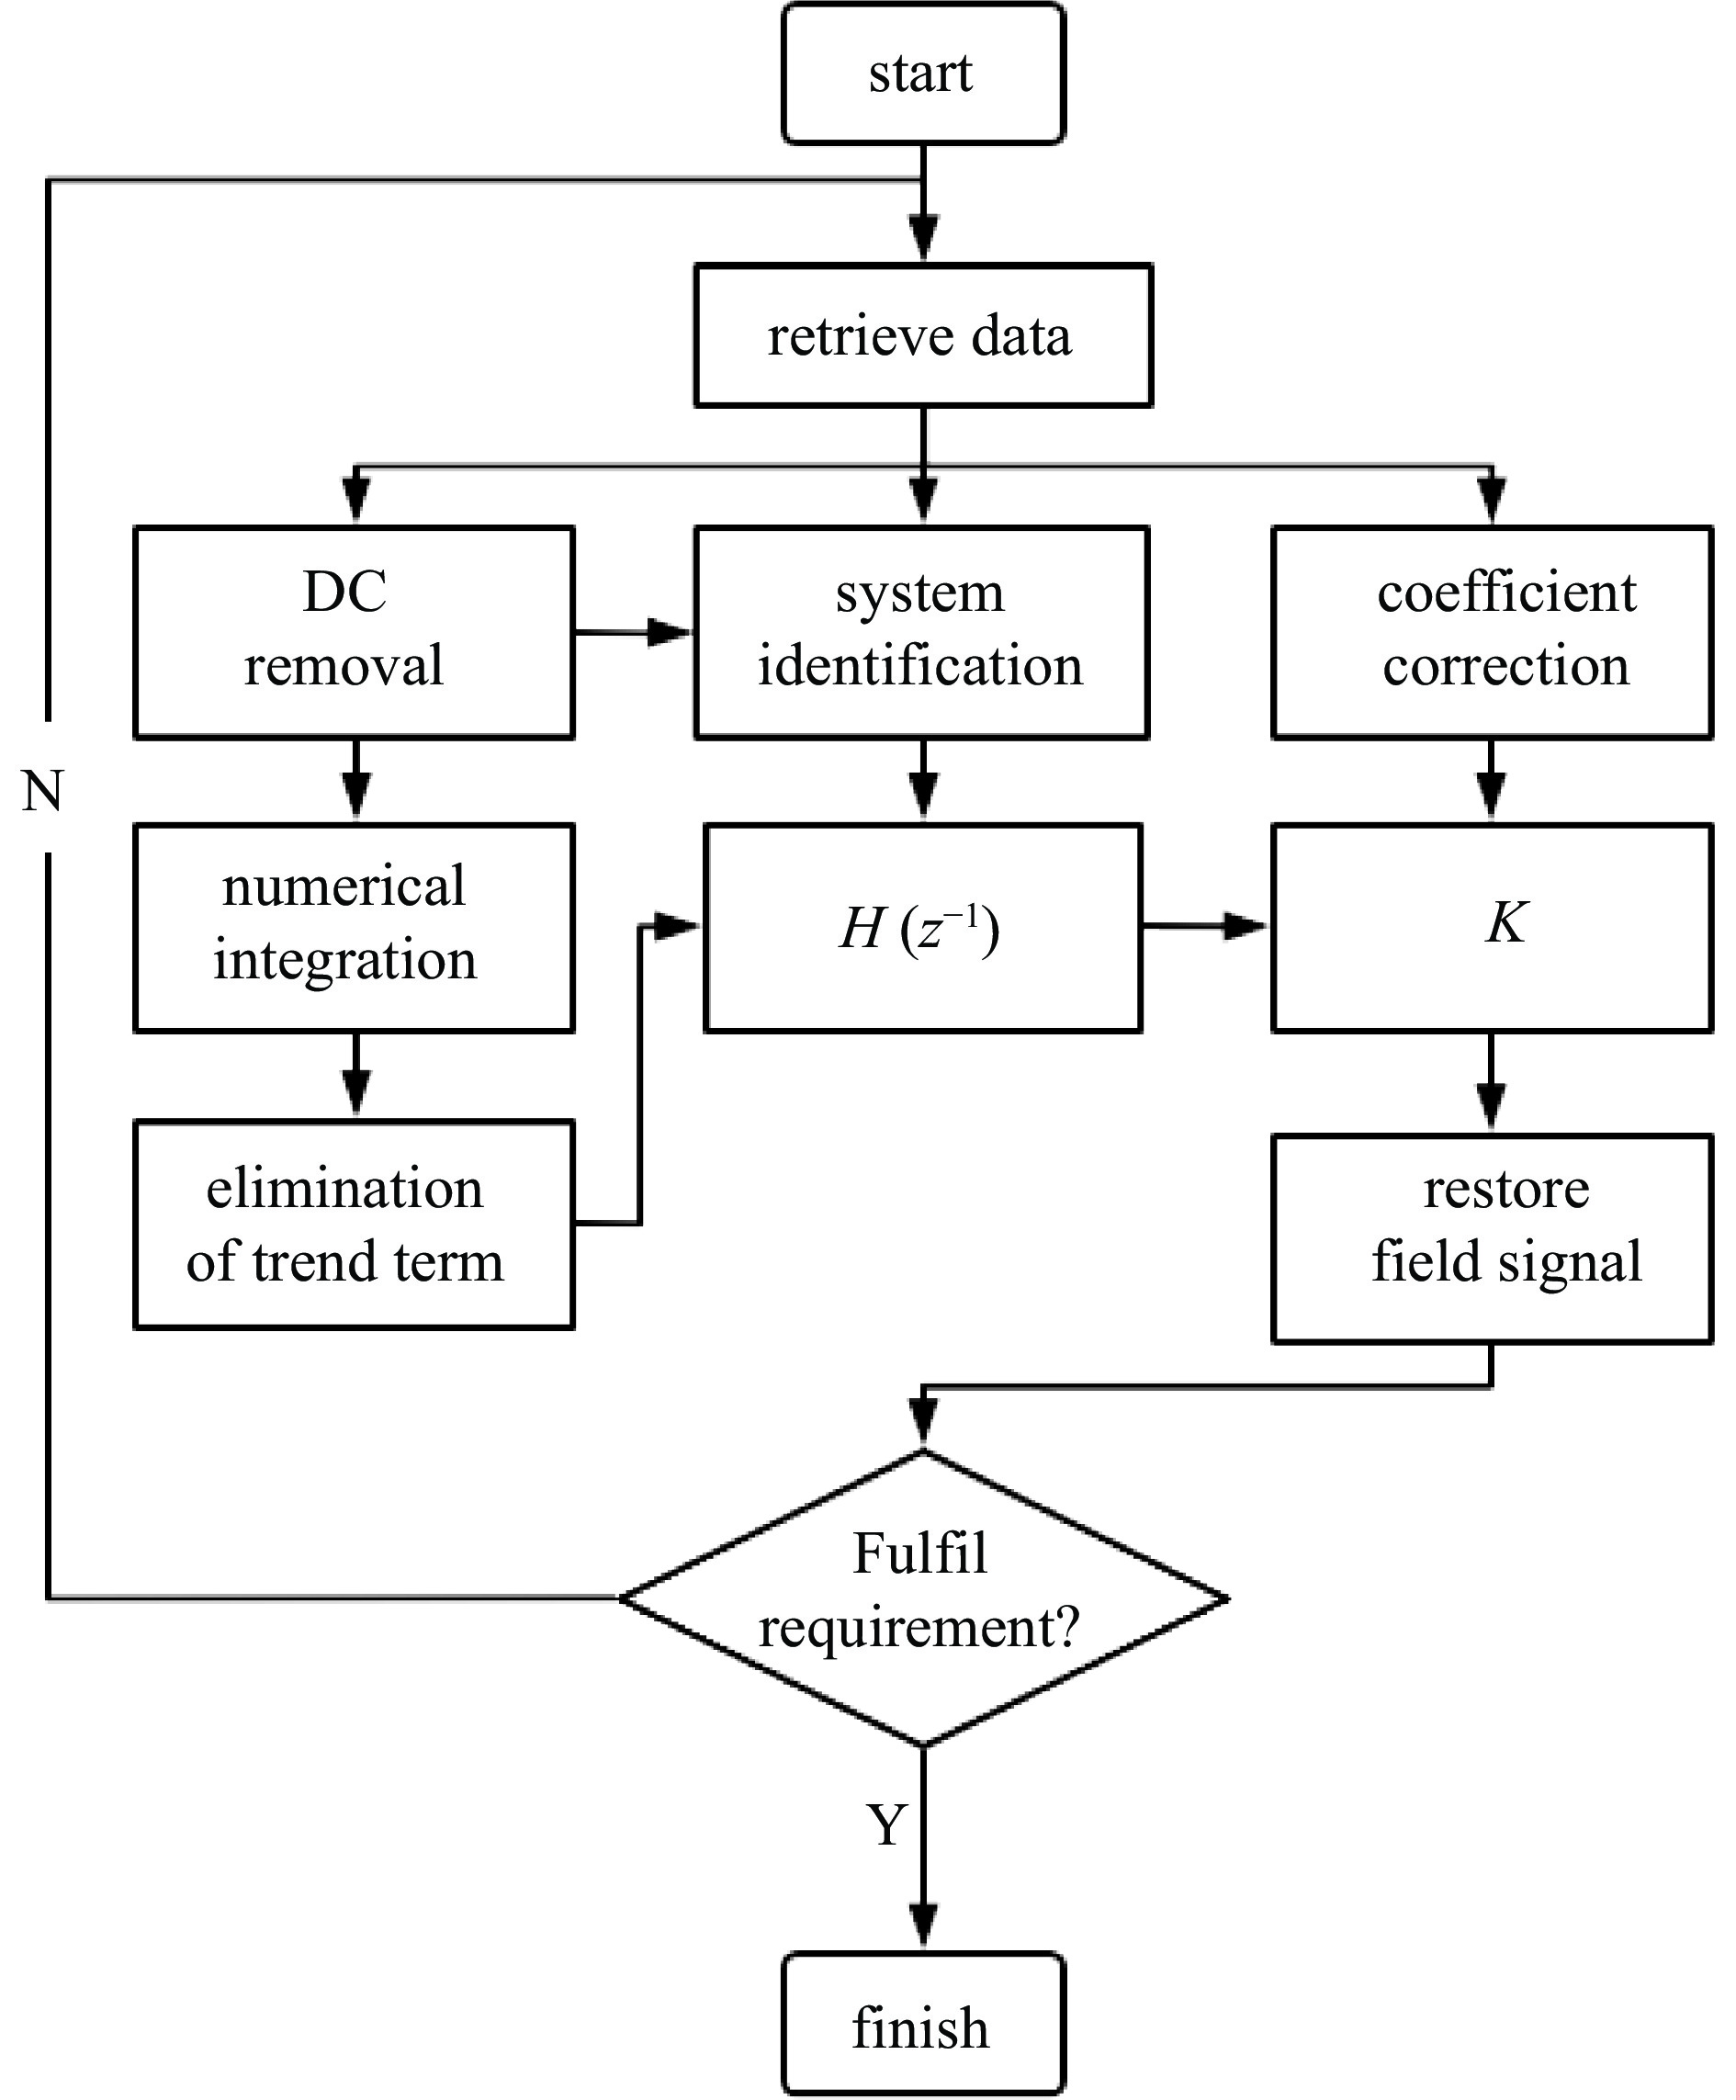
Fig. 2. Waveform reduction process
Fig. 3. The transient electric field waveform restoration system
Fig. 4. Square wave source electric field signal and D-dot output differential signal
Fig. 5. Direct integration result of the electromagnetic pulse differential measurement signal after de-averaging
Fig. 6. Result of three methods to remove trend item
Fig. 7. Input signal and output signal of low frequency compensation identification system
Fig. 8. Comparison of direct integration and compensation after integration
Fig. 9. Transient electric field waveform restoration signal before and after correction factor calibration
Fig. 10. Rising edge of square wave signal before and after reduction
Fig. 11. Results comparison of two transient electric field waveform restoration methods
Fig. 12. Off-line arc electric field test system of pantograph
Fig. 13. D-dot sensor output differential signal and its amplitude spectrum
Fig. 14. Transient electric field waveform restoration system restored electric field signal and its amplitude spectrum
Fig. 15. Transient electric field restoration signals under different excitation voltages
|
Table 1. Three methods to eliminate root mean square error and correlation coefficient of trend term results
|
Table 2. Root mean square error and correlation coefficient of the signal before and after low frequency compensation
|
Table 3. Correlation coefficients of transient electric field restoration signals under different excitation voltages

Set citation alerts for the article
Please enter your email address
© Copyright 2018-2021 | Chinese Laser Press. All Rights Reserved 沪ICP备15018463号-20