• Photonics Research
  • Vol. 10, Issue 3, 802 (2022)
Litong Xu1、2、†, Dongwei Li1、†, Junwei Chang1, Deming Li1, Tingting Xi2、3、*, and Zuoqiang Hao1、4、*
Author Affiliations
  • 1Shandong Provincial Engineering and Technical Center of Light Manipulations & Shandong Provincial Key Laboratory of Optics and Photonic Device, School of Physics and Electronics, Shandong Normal University, Jinan 250358, China
  • 2School of Physical Sciences, University of Chinese Academy of Sciences, Beijing 100049, China
  • 3e-mail: ttxi@ucas.ac.cn
  • 4e-mail: zqhao@sdnu.edu.cn
  • show less
    DOI: 10.1364/PRJ.443501 Cite this Article Set citation alerts
    Litong Xu, Dongwei Li, Junwei Chang, Deming Li, Tingting Xi, Zuoqiang Hao. Powerful supercontinuum vortices generated by femtosecond vortex beams with thin plates[J]. Photonics Research, 2022, 10(3): 802 Copy Citation Text show less
    Experimental setup. EA, energy attenuator; BS, beam splitter; lens, f=2 m; M1–M5, 800 nm high reflection mirrors; SLM, spatial light modulator; ND, neutral filter; TFSP, thin fused silica plate; AM, aluminum mirror; Filters, suitable bandpass filters, short-pass filters, and long-pass filters. Inset, the phase map composed of a vortex phase with m=1 and a Fresnel lens phase with f=2 m.
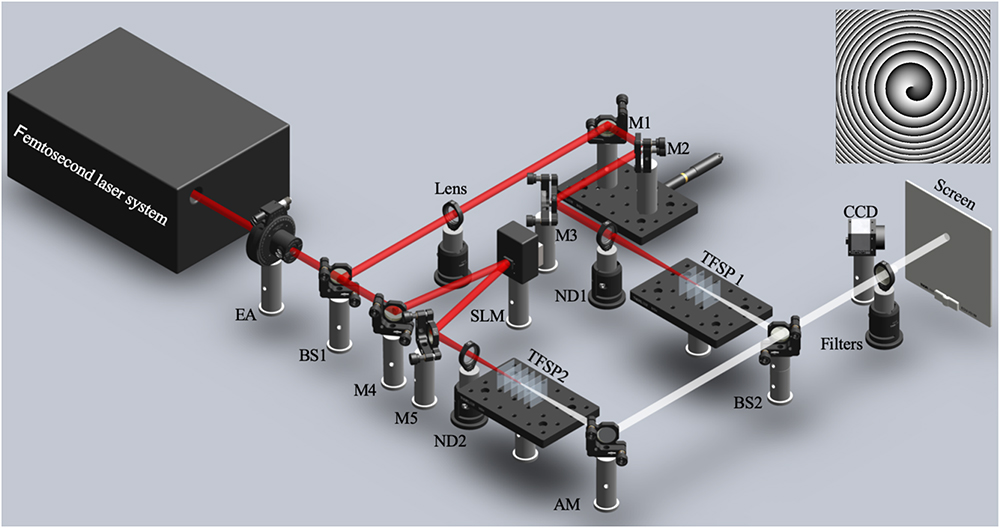
    Fig. 1. Experimental setup. EA, energy attenuator; BS, beam splitter; lens, f=2  m; M1–M5, 800 nm high reflection mirrors; SLM, spatial light modulator; ND, neutral filter; TFSP, thin fused silica plate; AM, aluminum mirror; Filters, suitable bandpass filters, short-pass filters, and long-pass filters. Inset, the phase map composed of a vortex phase with m=1 and a Fresnel lens phase with f=2  m.
    Simulated evolution of peak intensity and electron density in the plates and air. The pulse energy of the femtosecond vortex beam is 420 μJ, and topological charge m=1.
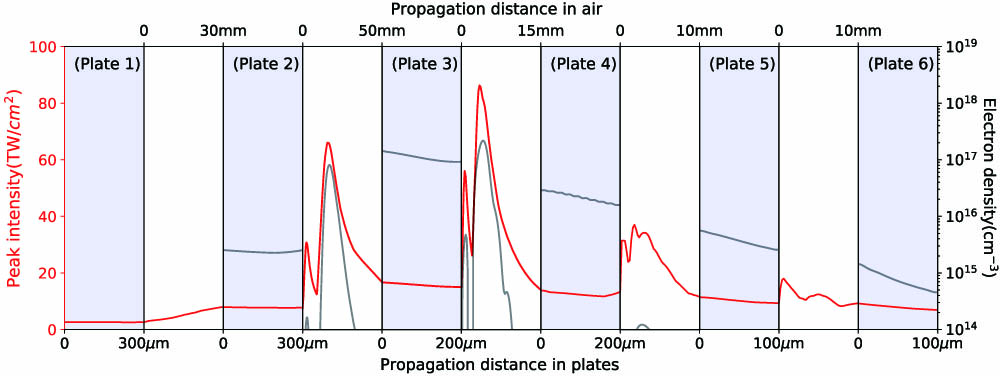
    Fig. 2. Simulated evolution of peak intensity and electron density in the plates and air. The pulse energy of the femtosecond vortex beam is 420 μJ, and topological charge m=1.
    (a) Simulated full-path spectrum evolution. (b) Transverse phase distribution of different spectral components for the femtosecond vortex beam with topological charge m=1.
    Fig. 3. (a) Simulated full-path spectrum evolution. (b) Transverse phase distribution of different spectral components for the femtosecond vortex beam with topological charge m=1.
    (a) Pulse shapes of the femtosecond vortex beam at several longitudinal positions. (b) The temporal intensity (solid lines) and phase (dashed lines) profiles at different transverse positions (marked by black stars in the inset) after plate 6.
    Fig. 4. (a) Pulse shapes of the femtosecond vortex beam at several longitudinal positions. (b) The temporal intensity (solid lines) and phase (dashed lines) profiles at different transverse positions (marked by black stars in the inset) after plate 6.
    Normalized transverse fluence distribution in the six plates. The first row denotes the front surface, and the second row denotes the back surface.
    Fig. 5. Normalized transverse fluence distribution in the six plates. The first row denotes the front surface, and the second row denotes the back surface.
    (a) Experimentally measured spectra of pump laser and supercontinuum after each plate. (b) Measured intensity distribution and (c) interference patterns after passing different filters. BP, bandpass; SP, short-pass; LP, long-pass. (d) The detected spectra after different filters. The pulse energy before the first plate is 468 μJ, and the topological charge m=1.
    Fig. 6. (a) Experimentally measured spectra of pump laser and supercontinuum after each plate. (b) Measured intensity distribution and (c) interference patterns after passing different filters. BP, bandpass; SP, short-pass; LP, long-pass. (d) The detected spectra after different filters. The pulse energy before the first plate is 468 μJ, and the topological charge m=1.
    (a) Simulated transverse phase of different spectral components. (b) Measured interference patterns after passing different filters; the filters are the same as in Fig. 6. The pulse energy before the first plate is 660 μJ, and the topological charge m=2. Five plates with thicknesses 300 μm, 300 μm, 200 μm, 200 μm, and 100 μm are used. Their spacings are 18 mm, 14 mm, 10 mm, and 16 mm.
    Fig. 7. (a) Simulated transverse phase of different spectral components. (b) Measured interference patterns after passing different filters; the filters are the same as in Fig. 6. The pulse energy before the first plate is 660 μJ, and the topological charge m=2. Five plates with thicknesses 300 μm, 300 μm, 200 μm, 200 μm, and 100 μm are used. Their spacings are 18 mm, 14 mm, 10 mm, and 16 mm.
    ParametersFused SilicaAir
    n2(1019  cm2/W)32000.96
    τR(fs)3270
    ωR1(fs)12.262.5
    Ui(eV)912.1
    σ  (1020  cm2)65.75.44
    τrec(fs)150+
    Table 1. Simulation Parameters at 800 nm
    Litong Xu, Dongwei Li, Junwei Chang, Deming Li, Tingting Xi, Zuoqiang Hao. Powerful supercontinuum vortices generated by femtosecond vortex beams with thin plates[J]. Photonics Research, 2022, 10(3): 802
    Download Citation