
Bowen You, Chenyin Ni, Zhonghua Shen. Laser Ultrasonic Real-Time Monitoring of Photothermal Modulation Crack Closure[J]. Chinese Journal of Lasers, 2019, 46(2): 0204009
- Chinese Journal of Lasers
- Vol. 46, Issue 2, 0204009 (2019)
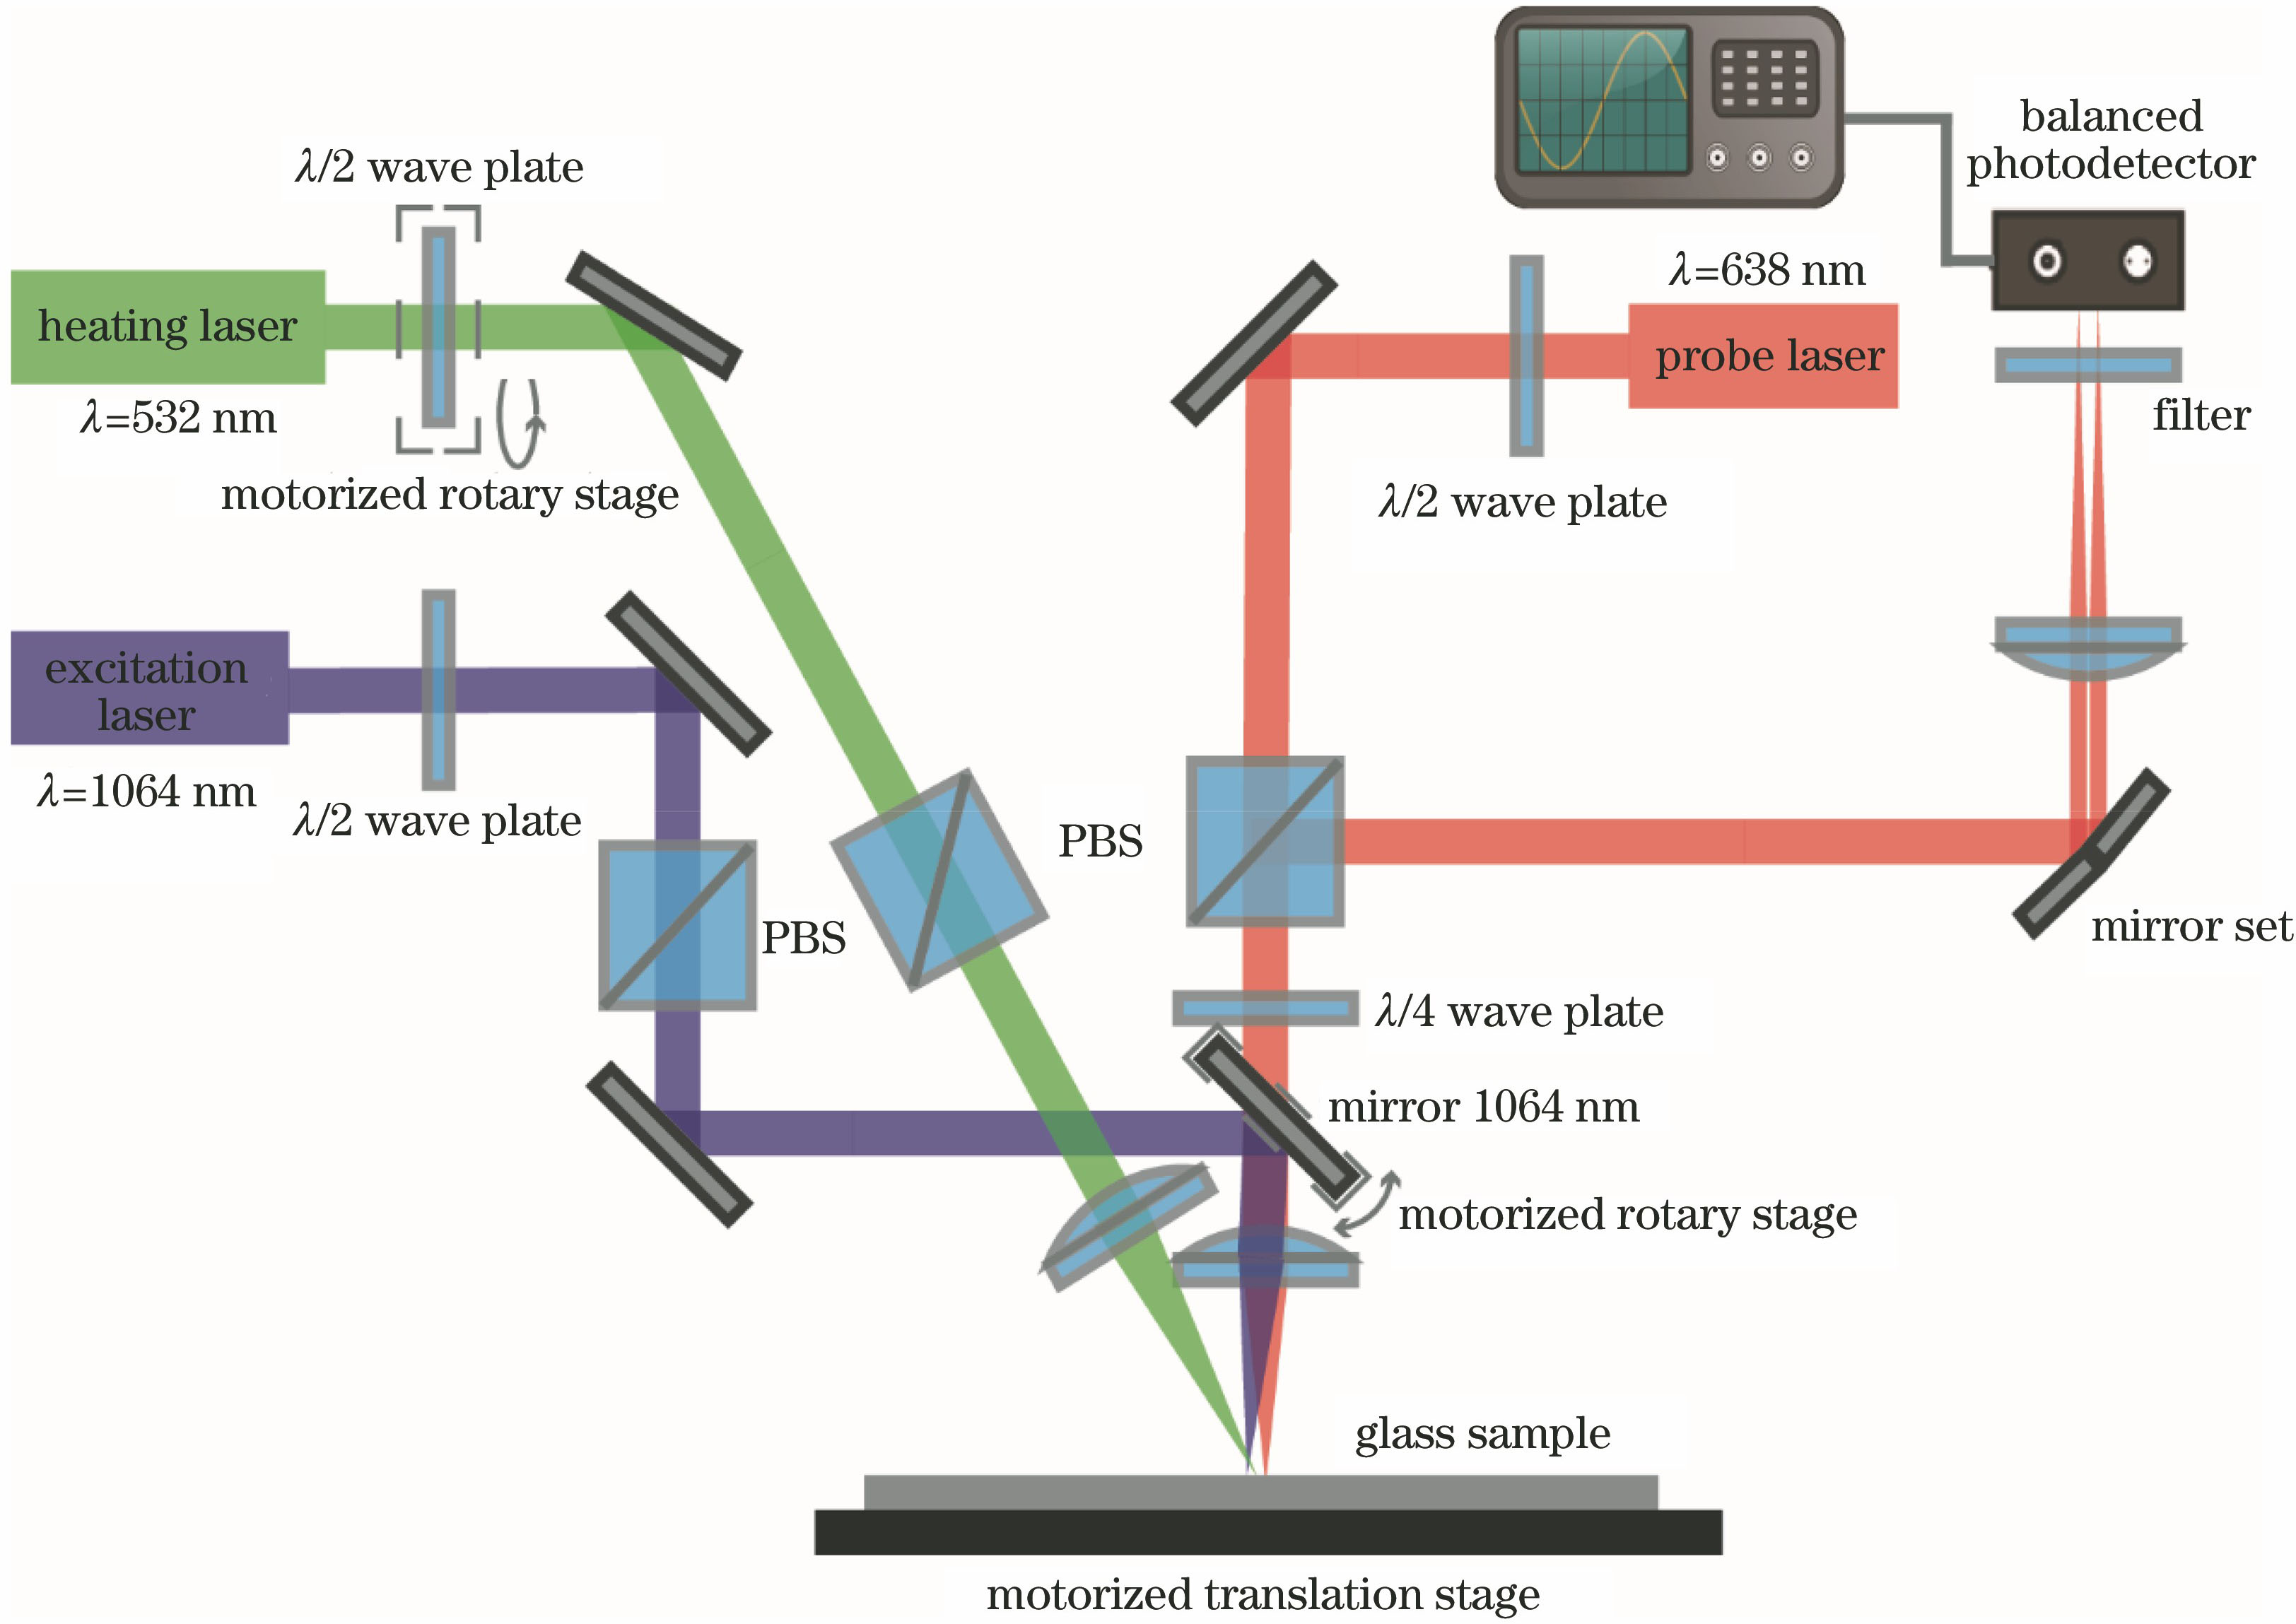
Fig. 1. Schematic of experimental system
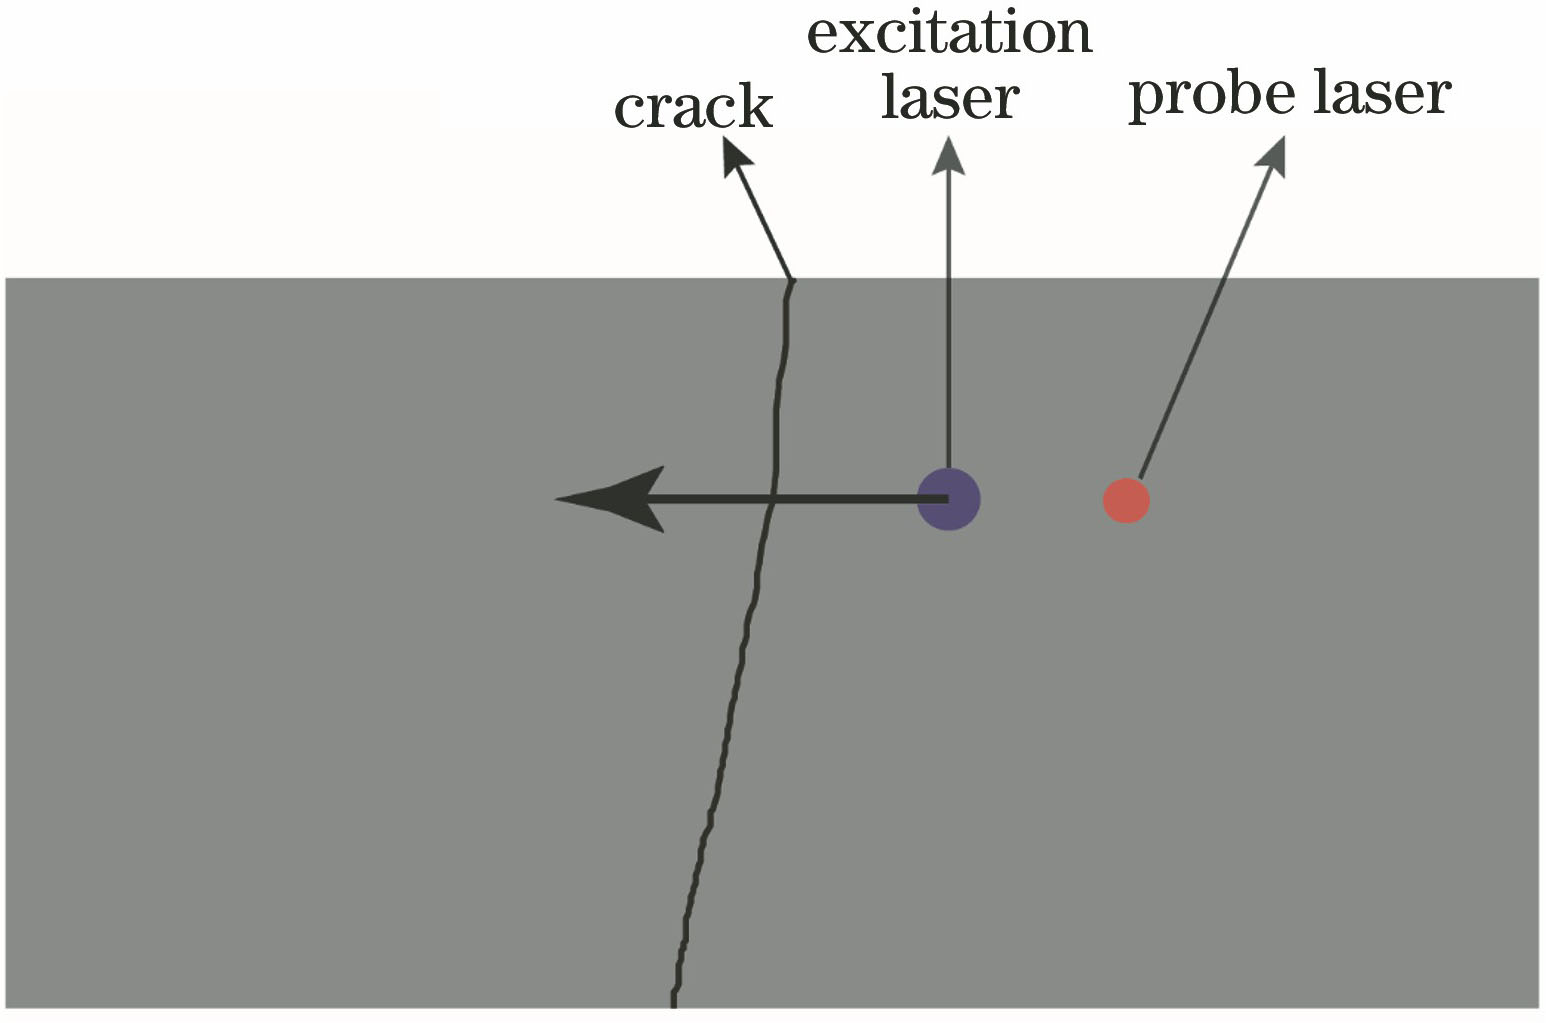
Fig. 2. Schematic of position of excitation laser, probe laser and crack on surface of sample
Fig. 3. b-scan image of ultrasonic signal based on TOFD
Fig. 4. Time domain waveforms obtained by TOFD. (a) Excitation laser scanning to step 9; (b) excitation laser scanning to step 40
Fig. 5. Schematic of position of excitation laser, heating laser, probe laser and crack on surface of sample during real-time monitoring
Fig. 6. Schematic of experimental process
Fig. 7. First type of experimental results. (a) Real-time monitoring results of tR signals for cracks under different power heating and natural cooling conditions; (b) real-time monitoring results of tL-R signals for cracks under different power heating and natural cooling conditions
Fig. 8. Second type of experimental results. (a) Real-time monitoring results of tR signals for cracks under different power heating and natural cooling conditions; (b) real-time monitoring results of tL-R signals for cracks under different power heating and natural cooling conditions
Fig. 9. Third type of experimental results. (a) Real-time monitoring results of tR signals for cracks under different power heating and natural cooling conditions; (b) real-time monitoring results of tL-R signals for cracks under different power heating and natural cooling conditions; (c) real-time monitoring results of tR signals for cracks under 200 mW power heating and natural cooling conditions
Fig. 10. Three-dimensional AFM image of crack at 1.5 mm from starting point of crack (a) and variation of asperity height on crack wall along crack direction (b)
Fig. 11. Crack morphology characteristics corresponding to first type of experimental results
Fig. 12. Crack morphology characteristics corresponding second type of experimental results
Fig. 13. Crack morphology characteristics corresponding to third type of experimental results

Set citation alerts for the article
Please enter your email address
© Copyright 2018-2021 | Chinese Laser Press. All Rights Reserved 沪ICP备15018463号-20