
Tao PEI, Ci SONG, Sihui GUO, Hua SHU, Yaxi LIU, Yunyan DU, Ting MA, Chenghu ZHOU. Big geodata mining: Objective, connotations and research issues[J]. Journal of Geographical Sciences, 2020, 30(2): 251
- Journal of Geographical Sciences
- Vol. 30, Issue 2, 251 (2020)
Abstract
Keywords
1 Introduction
After identifying the challenges and opportunities that massive data would bring to computer science and other disciplines, researchers in computer science some 30 years ago proposed the term data mining. In 1995,
2 Connotations and denotations of big geodata
Although big data has become a hot topic in many disciplines, the definitions regarding the connotations and denotations of big data remain unclear. In fact, the true meaning of defining big geodata is not to explicitly delineate what big geodata is, but to guide how to conduct big geodata analysis and how to overcome the limitations of big geodata in research.
In this paper, the essence of big data is considered to be the “full” coverage of sampling. Note that “full” here does not mean the samples fully cover the object without any space, but that the coverage substantially exceeds that of purposive sampling (here purposive sampling data are called “small data”). The “full” sampling information provided by big data exceeds the limitations of traditional sampling, which inevitably leads to a revolution in the mode of research. “Full” coverage here involves the dimensions of time, space and attributes. Similar to other fields, big geodata have 5V features, but big geodata also have their own unique features, which will be discussed later. The connotations of big geodata contain at least the following two considerations: first, a distinguishing feature between big geodata and other disciplines lies in whether there are time and space attributes; second, a difference between big geodata and small data is the sample coverage, which was mentioned earlier.
The unique connotations of big geodata originate from the mode of information acquisition, while the denotations are dependent on the means for information acquisition. According to the type of sensors used and the objects recorded, big geodata can be divided into two types: big earth observation data and big human behavior data. Among them, big earth observation data record the characteristics of elements of the earth’s surface, and the sensors are mainly satellite payload (e.g., aerospace or aviation-based) or surface monitoring devices, while the corresponding data include remote sensing imagery, unmanned aircraft imagery and various monitoring (or monitoring network) data. The big earth observation data are acquired mainly in active ways. Big human behavior data record various behavioral activities such as human mobility, socialization and consumption. The sensors are versatile and include mobile handsets, smart cards, social media applications and navigation system-generated signals. Differing from big earth observation data, big human behavior data are acquired mostly in passive ways. The human behavior data can be regarded as footprints of human activity, which include mobile phone signaling data, taxi trajectory data, Internet of Things data and social media data. The focuses of big geo-observation data and big human behavior data are “land” and “human,” respectively. The relationship between human development and geographical environment has always been a central topic in geography, and the advance of big geodata makes it possible to combine these two types of big data, thus providing new resources, new dynamics and new perspectives for the study of human-land relationship in geography. The two types of data focus on different objects, and their data structure, granularity and expression are different, which brings new challenges for big geodata mining.
3 Features of big geodata
The differences between big data and small data have been clarified in the previous section. However, besides the “5V” features, do big geodata have other unique features? The answer to this question could be crucial for analysis. To this end, intrinsic features are discussed from the perspective of the mechanism of generating big geodata. On the one hand, compared to small data, big geodata can be viewed as samples that cover fully the research object. Full coverage includes mainly three aspects: finer granularity, higher density and larger scale. On the other hand, big geodata, especially human behavior big geodata, are typically acquired in a non-purpose way, which may lead to bias and uncertainty. As a result, the features of big geodata can be summarized as spatiotemporal granularity, spatiotemporal scope, spatiotemporal density, spatiotemporal skewness and spatiotemporal precision, which will be explained in the following sections.
3.1 Spatiotemporal granularity
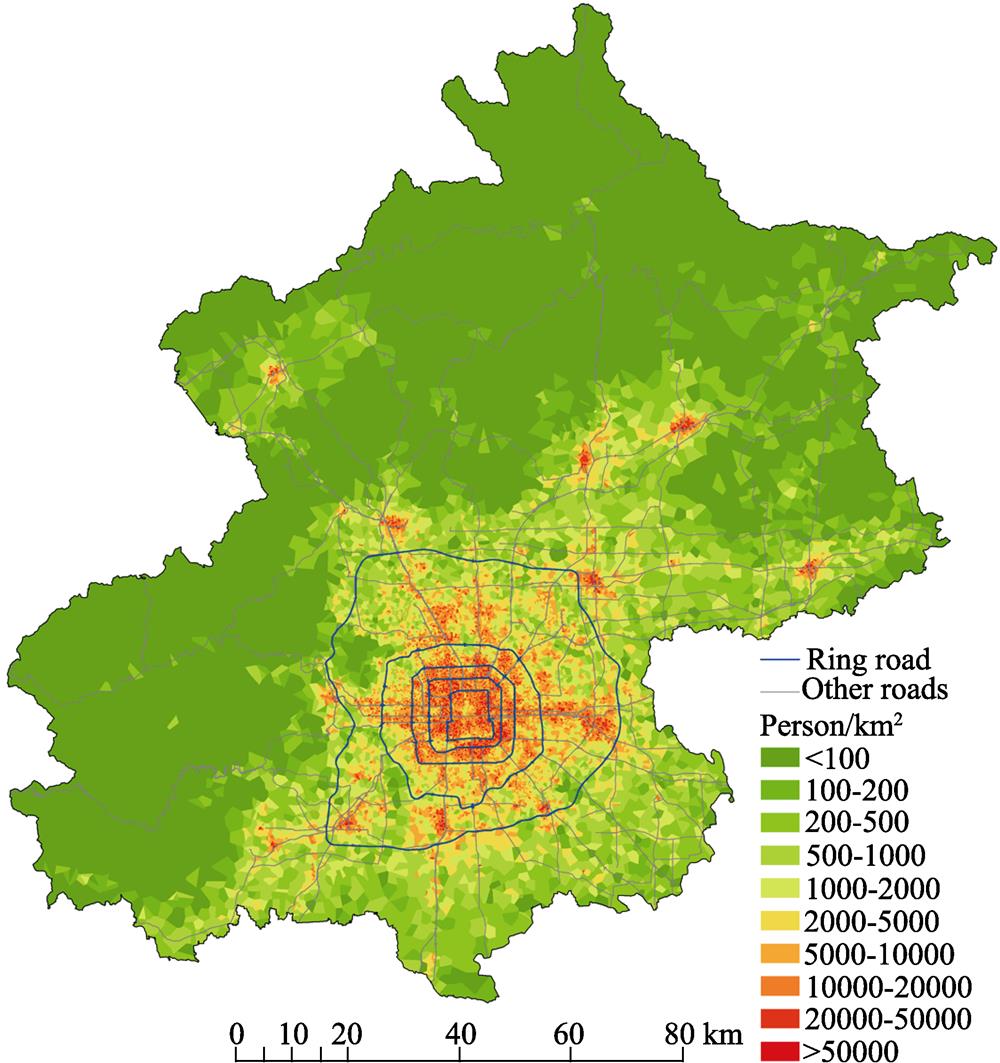
The spatiotemporal granularity is defined as the size of the support unit of geographic information. The emergence of big geodata makes the granularity smaller. Due to different data acquisition methods, the granularity may vary depending on the different types of data. With regard to big earth observation data, the granularity refers to the pixel size. The minification of the granularity brought by big data can be seen in the increasing refinement of retrieval results for the ground object. For example, enhancement of the resolution of urban images makes the unit of the retrieved information finer, which is changed from the coarse-grained land parcel to the concrete building. In big human behavior data, the granularity refers to the size of the statistical unit (
![]()
Figure 1.
3.2 Spatiotemporal scope
Traditionally, small geodata, due to the high cost of acquisition, are often restricted to local areas, or there is a balance between granularity and scale. In the era of big data, some IT companies take advantage of the Internet to obtain data at large scale meaning at a national or even global level, while at the same time maintaining high resolution. This approach thus ensures that the data cover the large scale and at high resolution. This type of global data product has been applied in many research fields, including global night-time remote sensing data products (
3.3 Spatiotemporal density
In addition to the limitation of coverage, traditional geographic research often faces issues regarding the problem of samples of sparse density due to the high cost of sampling. For this reason, the description of geographic distribution based on finite samples usually requires methods of spatial estimation and inference, such as Kriging interpolation (
3.4 Spatiotemporal bias
Although big geodata has demonstrated advantages over “small data” in terms of granularity, scope and density, there are certain flaws, which inevitably incur criticism. Specifically, bias exists ubiquitously in big human behavior data in terms of time, space and attributes. Taking Weibo data as an example, many studies use the data to infer urban functions and human behavior. In fact, serious bias exists in Weibo data mainly with respect to age, gender, space and content. Specifically, the bias due to age is that users of Weibo are mainly those between 18 and 30 years old; and a gender bias is that women are more inclined to use Weibo than men (
3.5 Spatiotemporal precision
Another aspect that cannot be ignored in big geodata is the low precision. The precision problem is ubiquitous in big data, especially for big geodata, and sometimes can even lead to wrong conclusions being made. Regarding big earth observation data, the precision problem has been extensively studied (
The impact of big geodata comes from its fine granularity, large scope and high density, and this is difficult to obtain from traditional small data, while the shortcomings of bias and low precision can be compensated for by use of small data. Therefore, big geodata and small data have their own advantages and disadvantages and one cannot completely replace the other. The combination of the two may draw on the strong points of big data to offset any weaknesses. In the application of big geodata, more attention should be paid to its limitations so as to avoid the generation of errors and abuse of the data.
4 Core issues of big geodata mining
As we know, the value of data lies in the knowledge hidden in it (
4.1 Expression of big geodata: location space and flow space
The objects that big earth observation data focus are on the surface of the earth, while the subjects of big human behavior data are human. The interaction between the earth’s surface and human being can be viewed as relationships between the subjects and the environment. The basis of earth observation data is location, on which the variation of geographical attributes can be observed and measured. In geographical research, earth observation data can be viewed as containing the environmental factors which affect human behavior and activities. This location-based data can be expressed in the framework of location space, where location is the basic element and Euclidean distance is the basic measurement (
Big human behavior data are a reflection of human activities. In human-related activities and interactions, flow can be seen as a basic unit (flow can be defined as a point pair containing an origin (O) point and a destination (D) point) which includes human flow, commodity flow, information flow, capital flow and relationship flow. A flow can be thought of as an interaction between two nodes (locations) (
4.2 Content of big geodata mining: patterns and relationships
The purpose of geographical data mining is to find rules and exceptions between geographical objects as well as between geographical objects and the environment. Accordingly, the content of big geodata mining can also be divided into two parts: the first part is the mining of geographical spatiotemporal patterns, the essence of which is to discover the spatiotemporal distributions of geographical objects; the second is the mining of geographical spatiotemporal relations, the essence of which is to discover the relationships between the geographical objects and their environmental factors. Due to the distinct features of big geodata, the contents of mining big geodata are different from those of “small data”.
4.2.1 Spatiotemporal patterns in geography
The currently acknowledged theorems in geography are the first law of spatial correlation and the second law of spatial heterogeneity (
4.2.2 Geographical spatiotemporal relationship
The relationships between geographic objects and environmental factors usually appear as correlations or associations. Correlation is often used to characterize the quantitative relationship between attributes of geographic objects and their environmental factors, say the relationship between the level of soil lead (Pb) pollution and its proximity to highways (
It should be noted that compared with small data, big geodata may demonstrate “stronger” spatiotemporal correlation. As a result, it is relatively easy to “discover” various spatiotemporal relationships from them. Given that the causes of these relationships are often very complicated, whether there is a causal relationship or not needs to be carefully checked for. Taking the co-occurrence of theft and burglary cases as an example, the actual reason for their co-occurrence may be that the natural and social environment in a particular region is poor, thus resulting in high incidences of various types of crimes, however, there is no obvious causal relationship between these various crimes (
4.3 Inner structure of the geographic pattern: scale and superposition
As mentioned above, the purpose of big geodata mining is to extract the spatiotemporal patterns and the spatiotemporal relationships. Numerous studies have shown that geographical patterns, distributions and processes are all scale dependent. In other words, any geographic pattern can occur at a certain scale, so big geodata mining is inseparable from scale. Specifically, the purpose of pattern mining is to identify the groups such that objects are similar for the same group and different between different groups. The seeming contradiction between heterogeneity and homogeneity can be transformed by a change of scale. For instance,
![]()
Figure 2.
The scalability in data mining can be seen as the difference between patterns mined at different observation scales. Based on this,
4.4 Knowledge discovered from big geodata: human-environment relationships behind geographical patterns
Geodata mining can generally be divided into two stages, the discovery of non-trivial patterns and the exploration of the causes of the patterns. Concerning big geodata mining, the purpose of big earth observation data mining is to uncover the patterns of elements of the earth’s surface, while that of big human behavior data mining is to reveal the human behavior patterns. After that, a key question is what are the underlying mechanisms behind the patterns? Big geodata, especially the emergence of big human behavior data, constitutes the complete condition for revealing the mechanism of geographic patterns from the perspective of human-environment relationships. Landuse patterns, reflecting the characteristics of elements of the earth’s surface, are definitely the result of human behavior. Mobile phone call data record communication behavior and the data may vary for different areas, but the data indeed contain information about the urban function (
Geographic research has evolved from the first paradigm to the fourth paradigm, i.e., the empirical paradigm (first paradigm), the positivistic paradigm (second paradigm), the system simulation paradigm (the third paradigm) and the data-driven paradigm (the fourth paradigm) (
5 Big geodata mining methods
Given the dramatic growth of big geodata, various data mining methods have been developed to discover the non-trivial knowledge. These methods can be categorized in different ways according to whether there is a dependency or not on prior knowledge, that is, the methods can be categorized as a model-driven approach or a data-driven approach (
Due to the “5V” and other five features of big geodata, several problems need to be addressed when applying traditional data mining methods to big geodata mining. First, large volumes of data pose a serious challenge to data mining methods. Big data equate to high computational cost, therefore, how to conduct parallel and distributed computing is an essential problem that needs to be solved. Second, the emergence of big data often produces two types of effects when applying the methods to complex questions. On the one hand, some models can be simplified as the volume of data increases. For example, traditional methods using the shortest path analysis mainly depend on the complex optimization model, while, with the emergence of big GPS data, the recoding of the trajectories of floating cars makes it a simple query (
6 Conclusion
The coming of the big data era has significantly influenced the development of geographic research. As a special type of big data, the challenges that big geodata mining faces mainly originate from three sources. The first is the aggregation of multi-source big geodata. Big geodata are varied in terms of granularity, presentation and structure. How to realize “vertical” fusion through joining non-spatial attributes and “horizontal” integration by extending the spatiotemporal scope will become the key to mining big geodata in the future. The second is uncertainties caused by the bias and precision of big geodata. How to evaluate and apply the mining results is an unavoidable challenge. Third, producing “non-trivial” knowledge is a tough task for big geodata mining. Current research has generated some notable achievements in statistical physics and AI, nevertheless, the role, which data mining plays in the geographic sciences, has not been widely recognized as yet. For instance, although the uneven pattern of demographics in China can be revealed by examination of the Tencent location request data (https://heat.qq.com/index.php), and as spectacular as it is, this basic pattern was revealed as the “Hu Line” several decades ago.
Facing the challenges mentioned above, the future of big geodata mining seems not difficult to predict. First, big geodata mining should address and solve the basic problems of geographic science at the large scale with a finer granularity and with more comprehensive data. Global change and its impact on society, human behavior and its relationship to the environment, the social characteristics of the earth’s surface and urban dynamics are considered the hotspots for future study. Second, big geodata mining methods will evolve by adapting themselves to the “5Vs” and the other five features mentioned above. On the one hand, only more efficient and robust algorithms can be adapted to undertake the complex big geodata mining tasks; on the other hand, new AI methods, including training with large volume samples, will introduce new expectations for solving complex geographical problems. Third, research on big earth observation data will extend from the traditional observations of the earth’s surface to the perceptions of social activities, and may bring more scientific and commercial applications, whereas research on big human behavior data will extend from the perception of social activities to the retrieval of earth surface features, and become more widely used in urban studies. The combination of these two types of big data will eventually form a breakthrough to reveal the human-land relationships in geographic sciences.
References
[1] C Andrieu, Freitas N De, A Doucet et al. An introduction to MCMC for machine learning. Machine learning, 50, 5-43(2003).
[2] P M Atkinson, A R L Tatnall. Neural networks in remote sensing: Introduction. International Journal of Remote Sensing, 18, 699-709(1997).
[3] M Batty. The New Science of Cities(2013).
[4] C M Beale, J J Lennon, J M Yearsley et al. Regression analysis of spatial data. Ecology Letters, 13, 246-264(2010).
[5] U C Benz, P Hofmann, G Willhauck et al. Multi-resolution, object-oriented fuzzy analysis of remote sensing data for GIS-ready information. ISPRS Journal of Photogrammetry and Remote Sensing, 58, 239-258(2004).
[6] R G Brereton, G R Lloyd. Support vector machines for classification and regression. Analyst, 135, 230-267(2010).
[7] C Brunsdon, A S Fotheringham, M E Charlton. Geographically weighted regression: A method for exploring spatial nonstationarity. Geographical Analysis, 28, 281-298(1996).
[8] C Brunsdon, S Fotheringham, M Charlton. Geographically weighted regression. Journal of the Royal Statistical Society: Series D (The Statistician), 47, 431-443(1998).
[9] G F Byrne, P F Crapper, K K Mayo. Monitoring land-cover change by principal component analysis of multitemporal Landsat data. Remote Sensing of Environment, 10, 175-184(1980).
[10] M Castells. Grassrooting the space of flows. Urban Geography, 20, 294-302(1999).
[11] P S Castro, D Zhang, S Li. Urban traffic modelling and prediction using large scale taxi GPS traces. Proceeding of Pervasive’12 Proceedings of the 10th International Conference on Pervasive Computing, Newcastle, UK, June 18-22, 2012, 57-72(2012).
[12] J Chen, Y Ban, S Li. China: Open access to Earth land-cover map. Nature, 514, 434(2015).
[13] Long Chen, Neil Stuart, A Mackaness. Williams. Cluster and hot spot analysis in Lincoln, Nebraska, USA. Geomatics and Spatial Information Technology, 38, 189-192(2015).
[14] M S Chen, J Han, P S Yu. Data mining: An overview from a database perspective. IEEE Transactions on Knowledge and Data Engineering, 8, 866-883(1996).
[15] Changxiu Cheng, Peijun Shi, Changqing Song et al. Geographic big-data: A new opportunity for geography complexity study. Acta Geographica Sinica, 73, 1397-1406(2018).
[16] R Cheng, T Emrich, H P Kriegel et al. Managing uncertainty in spatial and spatio-temporal data. Proceedings of the IEEE 30th International Conference on Data Engineering (ICDE), Chicago, IL, USA, Mar 31-Apr 04, 1302-1305(2014).
[17] R G Congalton. A review of assessing the accuracy of classifications of remotely sensed data. Remote Sensing of Environment, 37, 35-46(1991).
[18] J Dai, B Yang, C Guo et al. Personalized route recommendation using big trajectory data. Proceedings of the 2015 IEEE 31st International Conference on Data Engineering (ICDE), Seoul, South Korea, April 13-17, 2015, 543-554(2015).
[20] Zhenyu Du, Shangjun Xing, Yumin Song et al. Lead pollution along expressways and its attenuation by green belts in Shandong province. Journal of Soil and Water Conservation, 21, 175-179(2007).
[21] S Džeroski. Relational Data Mining. Boston, MA: Springer, 887-911(2009).
[22] M Ester, H P Kriegel, J Sander et al. A density-based algorithm for discovering clusters in large spatial databases with noise. Proceeding KDD’96 Proceedings of the Second International Conference on Knowledge Discovery and Data Mining, Portland, OR, USA, Aug 02-04, 226-231(1996).
[23] U Fayyad, G Piatetsky-Shapiro, P Smyth. The KDD process for extracting useful knowledge from volumes of data. Communications of the ACM, 39, 27-34(1996).
[24] M A Friedl, C E Brodley. Decision tree classification of land cover from remotely sensed data. Remote Sensing of Environment, 61, 399-409(1997).
[25] J Ginsberg, M H Mohebbi, R S Patel et al. Detecting influenza epidemics using search engine query data. Nature, 457, 1012-1015(2009).
[26] P O Gislason, J A Benediktsson, J R Sveinsson. Random forests for land cover classification. Pattern Recognition Letters, 27, 294-300(2006).
[27] M F Goodchild. The validity and usefulness of laws in geographic information science and geography. Annals of the Association of American Geographers, 94, 300-303(2004).
[28] M F Goodchild, M Yuan, T J Cova. Towards a general theory of geographic representation in GIS. International Journal of Geographical Information Science, 21, 239-260(2007).
[29] J Han, J G Lee, M Kamber. An overview of clustering methods in geographic data analysis. Geographic Data Mining and Knowledge Discovery, 2, 149-170(2009).
[30] Zhigang Han, Yunfeng Kong, Yaochen Qin. Research on geographic representation: A review. Progress in Geography, 30, 141-148(2011).
[31] J M Harvey, J W Han. Geographic Data Mining and Knowledge Discovery(2009).
[32] Y Huang, S Shekhar, H Xiong. Discovering colocation patterns from spatial data sets: A general approach. IEEE Transactions on Knowledge and Data Engineering, 16, 1472-1485(2004).
[33] S Keola, M Andersson, O Hall. Monitoring economic development from space: Using nighttime light and land cover data to measure economic growth. World Development, 66, 322-334(2015).
[34] X Kong, Z Xu, G Shen et al. Urban traffic congestion estimation and prediction based on floating car trajectory data. Future Generation Computer Systems: The International Journal of EScience, 61, 97-107(2016).
[35] K Koperski, J Han. Discovery of spatial association rules in geographic information databases. Proceedings of the 4th International Symposium on Large Spatial Databases (SSD 95), Portland, ME, USA, Aug 06-09, 47-66(1995).
[36] K Koperski, J Han, N Stefanovic. An efficient two-step method for classification of spatial data. Proceedings of the 8th International Symposium on Spatial Data Handling (SDH’98), Vancouver, BC, Canada, July 11-15, 1998, 45-54(1998).
[37] D Lazer, R Kennedy, G King et al. The parable of Google Flu: Traps in big data analysis. Science, 343, 1203-1205(2014).
[38] Y LeCun, Y Bengio, G Hinton. Deep learning. Nature, 521, 436-444(2015).
[39] Deren Li, Tao Cheng. Knowledge discovery from GIS databases. Acta Geodaetica et Cartographica Sinica, 24, 37-44(1995).
[40] Deren Li, Shuliang Wang, Deyi Li et al. Theories and technologies of spatial data mining and knowledge discovery. Geomatics and Information Science of Wuhan University, 27, 221-233(2002).
[41] Deren Li, Shuliang Wang, Wenzhong Shi et al. On spatial data mining and knowledge discovery. Geomatics and Information Science of Wuhan University, 26, 491-499(2001).
[42] X Li, A G O Yeh. Neural-network-based cellular automata for simulating multiple land use changes using GIS. International Journal of Geographical Information Science, 16, 323-343(2002).
[43] Yang Liu, Ronggao Liu. Retrieval of global long-term leaf area index from LTDR AVHRR and MODIS observations. Journal of Geo-Information Science, 17, 1304-1312(2015).
[44] Yu Liu. Revisiting several basic geographical concepts: A social sensing perspective. Acta Geographica Sinica, 71, 564-575(2016).
[45] Z Liu, T Ma, Y Du et al. Mapping hourly dynamics of urban population using trajectories reconstructed from mobile phone records. Transactions in GIS, 22, 494-513(2018).
[46] B Marr. Big Data: Using SMART Big Data, Analytics and Metrics to Make Better Decisions and Improve Performance. Chichester, UK: John Wiley & Sons(2015).
[47] V Mayer-Schonberger, K Cukier. Big Data: A Revolution That Will Transform How We Live, Work, and Think. London: John Murray(2013).
[48] D P McMillen. Geographically weighted regression: The analysis of spatially varying relationships. American Journal of Agricultural Economics, 86, 554-556(2004).
[49] H J Miller, M F Goodchild. Data-driven geography. GeoJournal, 80, 449-461(2015).
[50] T K Moon. The expectation-maximization algorithm. IEEE Signal Processing Magazine, 13, 47-60(1996).
[51] O Mutanga, E Adam, M A Cho. High density biomass estimation for wetland vegetation using WorldView-2 imagery and random forest regression algorithm. International Journal of Applied Earth Observation and Geoinformation, 18, 399-406(2012).
[53] A Newing, B Anderson, A B Bahaj et al. The role of digital trace data in supporting the collection of population statistics: The case for smart metered electricity consumption data. Population, Space and Place, 22, 849-863(2016).
[54] D Niemeijer. Developing indicators for environmental policy: Data-driven and theory-driven approaches examined by example. Environmental Science & Policy, 5, 91-103(2002).
[55] N Niu, X P Liu, H Jin et al. Integrating multi-source big data to infer building functions. International Journal of Geographical Information Science, 31, 1871-1890(2017).
[57] J Novembre, T Johnson, K Bryc et al. Genes mirror geography within Europe. Nature, 456, 98-101(2008).
[58] M A Oliver, R Webster. Kriging: A method of interpolation for geographical information systems. International Journal of Geographical Information System, 4, 313-332(1990).
[59] M Pal, P M Mather. Support vector machines for classification in remote sensing. International Journal of Remote Sensing, 26, 1007-1011(2005).
[60] T Pei, J Gao, T Ma et al. Multi-scale decomposition of point process data. GeoInformatica, 16, 625-652(2012).
[61] T Pei, S Sobolevsky, C Ratti et al. A new insight into land use classification based on aggregated mobile phone data. International Journal of Geographical Information Science, 28, 1988-2007(2014).
[62] Tao Pei, Ting Li, Chenghu Zhou. Spatiotemporal point process: A new data model, analysis methodology and viewpoint for geoscientific problem. Journal of Geo-Information Science, 15, 793-800(2013).
[63] Chengcheng Qian, Ge Cheng. Big data science for ocean: Present and future. Bulletin of Chinese Academy of Sciences, 33, 884-891(2018).
[64] D Silver, A Huang, C J Maddison et al. Mastering the game of Go with deep neural networks and tree search. Nature, 529, 484-489(2016).
[65] D Silver, J Schrittwieser, K Simonyan et al. Mastering the game of Go without human knowledge. Nature, 550, 354-359(2017).
[66] C Song, Z Qu, N Blumm et al. Limits of predictability in human mobility. Science, 327, 1018-1021(2010).
[67] M L Stein. Interpolation of Spatial Data: Some Theory for Kriging. New York: Springer Science & Business Media(2012).
[68] Zhongwei Sun, Zi Lu. A geographical perspective to the elementary nature of space of flows. Geography and Geo-Information Science, 21, 109-112(2005).
[69] W R Tobler. A computer movie simulating urban growth in the Detroit region. Economic Geography, 46, 234-240(1970).
[70] M M Vazifeh, P Santi, G Resta et al. Addressing the minimum fleet problem in on-demand urban mobility. Nature, 557, 534-538(2018).
[71] Haiqi Wang, Jinfeng Wang. Research on progress of spatial data mining. Geography and Geo-Information Science, 6-10(2005).
[72] J Yuan, Y Zheng, X Xie et al. T-Drive: Enhancing driving directions with taxi drivers’ intelligence. IEEE Transactions on Knowledge & Data Engineering, 25, 220-232(2013).
[73] Y Yuan, G Wei, Y Lu. Evaluating gender representativeness of location-based social media: A case study of Weibo. Annals of GIS, 24, 163-176(2018).
[74] P A Zandbergen. Positional accuracy of spatial data: Non-normal distributions and a critique of the national standard for spatial data accuracy. Transactions in GIS, 12, 103-130(2008).
[75] Wenjian Zhang. WMO integrated global observing system (WIGOS). Meteorological Monthly, 36, 1-8(2010).
[77] Z L Zhao, S L Shaw, Y Xu et al. Understanding the bias of call detail records in human mobility research. International Journal of Geographical Information Science, 30, 1738-1762(2016).
[78] Y Zheng, Y Liu, J Yuan et al. Urban computing with taxicabs. Proceedings of the 13th International Conference on Ubiquitous Computing, Beijing, China, September 17-21, 89-98(2011).
[79] A-X Zhu, F Qi, A Moore et al. Prediction of soil properties using fuzzy membership values. Geoderma, 158, 199-206(2010).
[80] A-X Zhu, L Yang, B Li et al. Construction of membership functions for predictive soil mapping under fuzzy logic. Geoderma, 155, 164-174(2010).


Set citation alerts for the article
Please enter your email address

© Copyright 2018-2021 | Chinese Laser Press. All Rights Reserved 沪ICP备15018463号-20