• Photonics Research
  • Vol. 6, Issue 5, 368 (2018)
Grzegorz Soboń1、*, Tadeusz Martynkien2, Dorota Tomaszewska1, Karol Tarnowski2, Paweł Mergo3, and Jarosław Sotor1
Author Affiliations
  • 1Laser & Fiber Electronics Group, Faculty of Electronics, Wroclaw University of Science and Technology, Wybrzeze Wyspianskiego 27, 50-370 Wroclaw, Poland
  • 2Faculty of Fundamental Problems of Technology, Wroclaw University of Science and Technology, Wybrzeze Wyspianskiego 27, 50-370 Wroclaw, Poland
  • 3Laboratory of Optical Fiber Technology, Maria Curie-Sklodowska University, pl. M. Curie-Sklodowskiej 3, Lublin, Poland
  • show less
    DOI: 10.1364/PRJ.6.000368 Cite this Article Set citation alerts
    Grzegorz Soboń, Tadeusz Martynkien, Dorota Tomaszewska, Karol Tarnowski, Paweł Mergo, Jarosław Sotor. All-in-fiber amplification and compression of coherent frequency-shifted solitons tunable in the 1800–2000  nm range[J]. Photonics Research, 2018, 6(5): 368 Copy Citation Text show less
    Experimental setup of the all-fiber tunable laser.
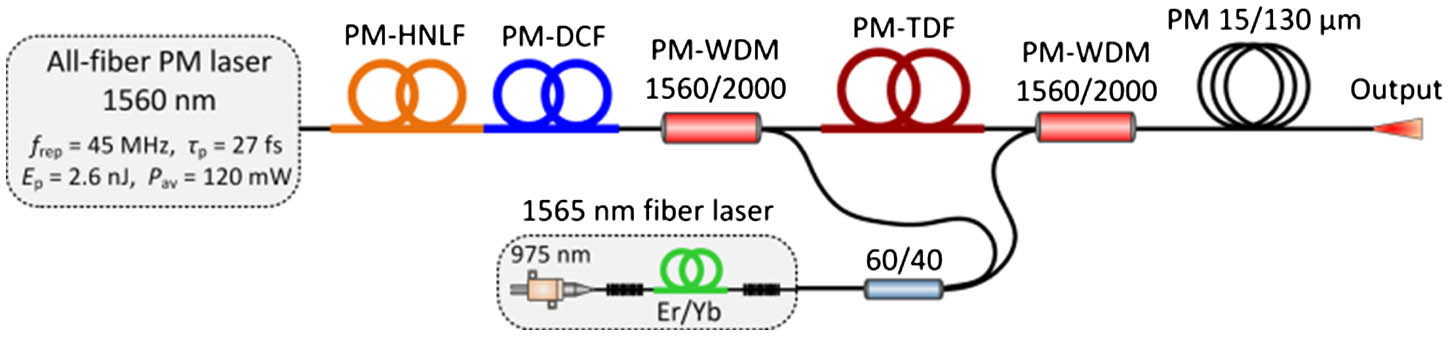
    Fig. 1. Experimental setup of the all-fiber tunable laser.
    (a) Measured dispersion and (b) phase modal birefringence of the PM-HNLF (round points), PM-DCF (squared points) and standard panda fiber (triangle points); (c) SEM images of the PM-HNLF end facet.
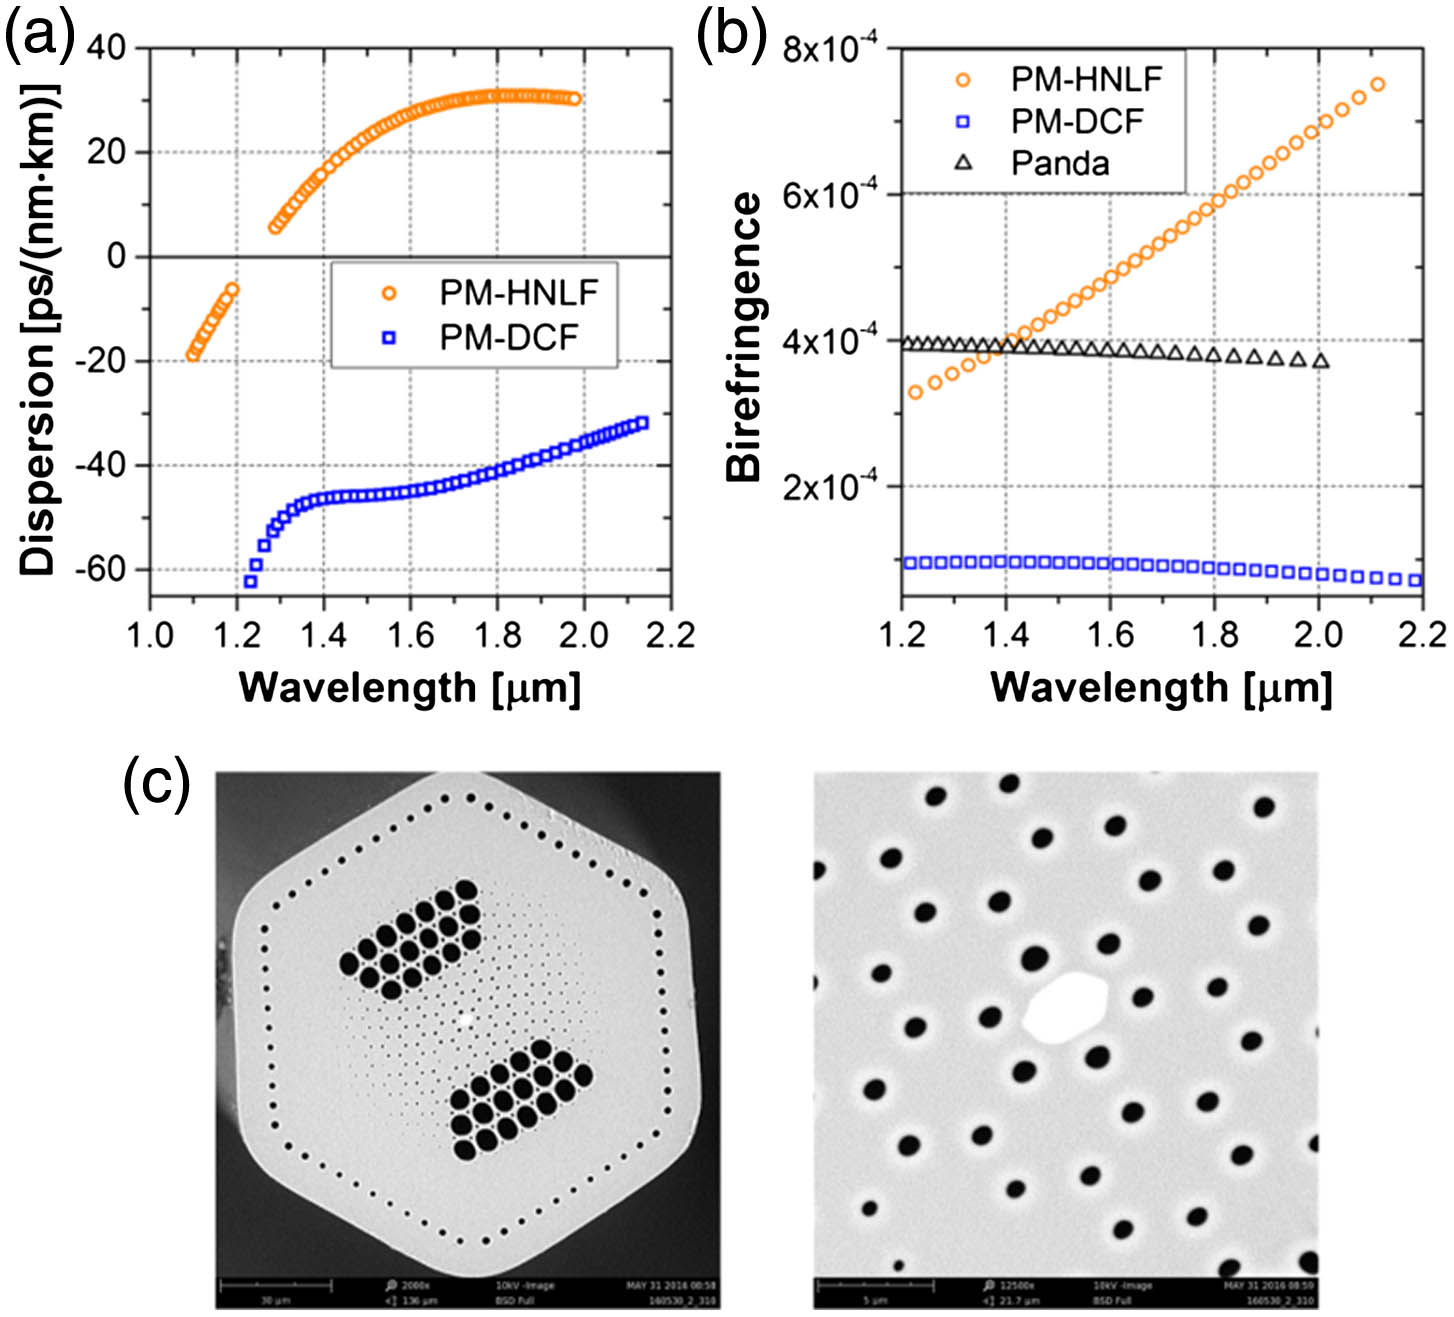
    Fig. 2. (a) Measured dispersion and (b) phase modal birefringence of the PM-HNLF (round points), PM-DCF (squared points) and standard panda fiber (triangle points); (c) SEM images of the PM-HNLF end facet.
    Transmission spectra registered for the polarizer and the analyzer aligned in parallel (black line) and crossed (red line) for both fibers: (a) PM-HNLF; (b) PM-DCF.
    Fig. 3. Transmission spectra registered for the polarizer and the analyzer aligned in parallel (black line) and crossed (red line) for both fibers: (a) PM-HNLF; (b) PM-DCF.
    Exemplary spectra of the frequency shifted solitons recorded directly at the output of the PM-HNLF, with indicated average power of the soliton.
    Fig. 4. Exemplary spectra of the frequency shifted solitons recorded directly at the output of the PM-HNLF, with indicated average power of the soliton.
    Interference patterns of consecutive soliton pulses, measured at different wavelengths. Blue line represents the calculated fringe visibility function. Red and green lines show the upper and lower envelopes of the interferograms, used for obtaining Imax and Imin, respectively.
    Fig. 5. Interference patterns of consecutive soliton pulses, measured at different wavelengths. Blue line represents the calculated fringe visibility function. Red and green lines show the upper and lower envelopes of the interferograms, used for obtaining Imax and Imin, respectively.
    (a) Measured optical spectra after amplification for different input soliton wavelengths, and (b) corresponding autocorrelation traces, with indicated length of the PM 15/130 compressing fiber. Dashed line: sech2 fit.
    Fig. 6. (a) Measured optical spectra after amplification for different input soliton wavelengths, and (b) corresponding autocorrelation traces, with indicated length of the PM 15/130 compressing fiber. Dashed line: sech2 fit.
    Average output power (square points, left scale) and pulse energy (round dots, right scale) after amplification and compression versus input soliton wavelength.
    Fig. 7. Average output power (square points, left scale) and pulse energy (round dots, right scale) after amplification and compression versus input soliton wavelength.
    Output beam quality measurement, indicating a mean M2 parameter value of 1.01 at 1950 nm.
    Fig. 8. Output beam quality measurement, indicating a mean M2 parameter value of 1.01 at 1950 nm.
    Amplification performance with standard PM single-mode fiber used as compressor. (a) Obtained maximum average power with indicated pulse duration at each wavelength; (b) pulse autocorrelation recorded at output power of 230 mW and 300 mW.
    Fig. 9. Amplification performance with standard PM single-mode fiber used as compressor. (a) Obtained maximum average power with indicated pulse duration at each wavelength; (b) pulse autocorrelation recorded at output power of 230 mW and 300 mW.
    Grzegorz Soboń, Tadeusz Martynkien, Dorota Tomaszewska, Karol Tarnowski, Paweł Mergo, Jarosław Sotor. All-in-fiber amplification and compression of coherent frequency-shifted solitons tunable in the 1800–2000  nm range[J]. Photonics Research, 2018, 6(5): 368
    Download Citation