
Yue Zhao, Fan Yang, Jia-Shi Sun, Xiang-Ping Li, Jin-Su Zhang, Xi-Zhen Zhang, Sai Xu, Li-Hong Cheng, Bao-Jiu Chen. Experimental optimal design of Er3+/Yb3+ co-doped Ba5Gd8Zn4O21 phosphor and red upconversion luminescence properties [J]. Acta Physica Sinica, 2019, 68(21): 213301-1
- Acta Physica Sinica
- Vol. 68, Issue 21, 213301-1 (2019)
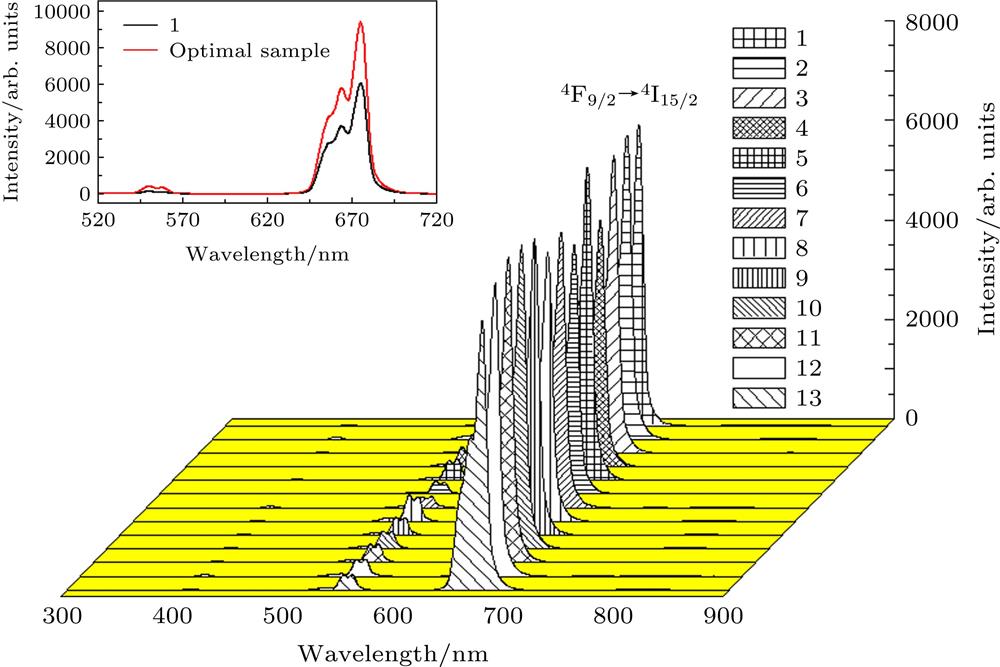
Fig. 1. Up-conversion emission spectra of Er3+/Yb3+ co-doped Ba5Gd8Zn4O21 phosphor under 1550 nm laser excitation. Inset picture shows the luminescence intensity of No. 1 sample and the optimal sample for comparison.
Er3+/Yb3+共掺Ba5Gd8Zn4O21在1550 nm激光激发下的上转换发射光谱(插图为1号样品与最优样品的发光强度对比)
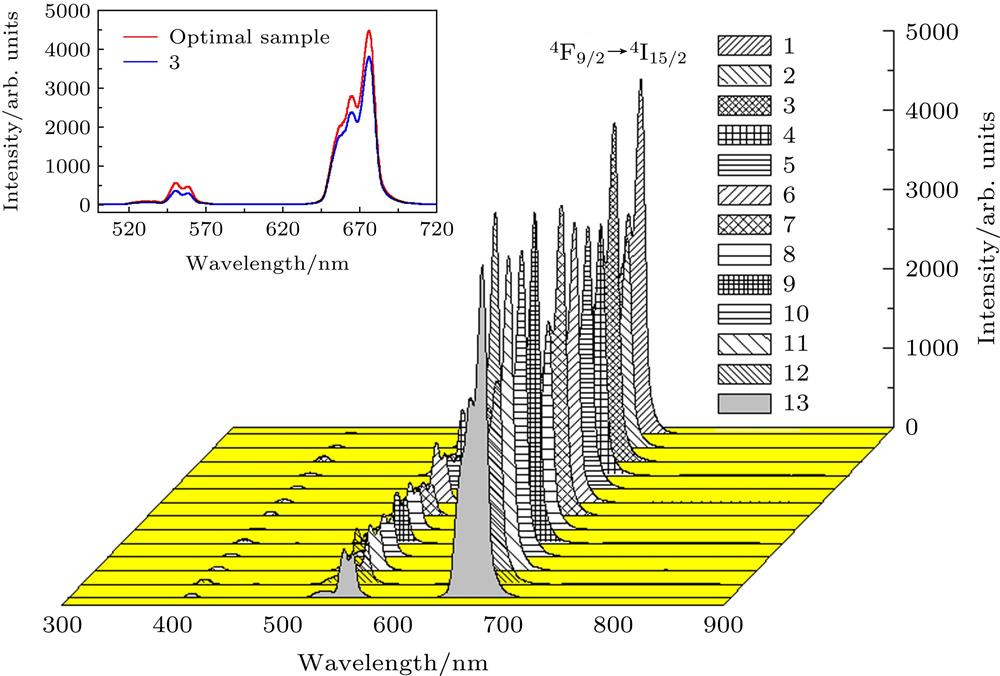
Fig. 2. Up-conversion emission spectra of Er3+/Yb3+ co-doped Ba5Gd8Zn4O21 phosphor under 980 nm laser excitation. Inset picture shows the luminescence intensity of No. 3 sample and the optimal sample for comparison.
Er3+/Yb3+共掺Ba5Gd8Zn4O21在980 nm激光激发下的上转换发射光谱(插图为3号样品与最优样品的发光强度对比)
Fig. 3. XRD patterns of samples, and standard peaks of Ba8Gd5Zn4O21 (JCPDS No.51-1686) are included for comparison.
样品的XRD与标准卡片JCPDS No.51-1686图样
Fig. 4. Dependence of the integrated intensity of up-conversion luminescence on laser working current.上转换发光强度积分与激光器工作电流的依赖关系
Fig. 5. Dependence of red up-conversion luminescence intensity on temperature under (a) 980 nm and (b) 1550 nm excitation for optimal samples.最优样品在(a) 980 nm与(b) 1550 nm激光激发下的红色上转换发光强度随温度的变化
Fig. 6. Dependence of red up-conversion luminescence intensity compared with commercial phosphor of NaYF4 under (a), (b) 980 nm and (c), (d) 1550 nm excitation for optimal samples.
在(a), (b) 980 nm和(c), (d) 1550 nm激光激发下最优样品与NaYF4商品粉末发光强度的比较
Fig. 7. The Multiple ratio of red up-conversion luminescence intensity compared with commercial phosphor of NaYF4 under 980 nm and 1550 nm excitation for optimal samples.
在980 nm和1550 nm激光激发下最优样品与NaYF4商品粉末发光强度的倍数比
Fig. 8. Comparison of red up-conversion luminescence intensity of optimal samples at the same power density.相同功率密度下最优样品的红光上转换发光强度比较
|
Table 1.
Uniform experimental design.
均匀试验设计
|
Table 2.
Natural factors level codes.
自然因素水平编码表
|
Table 3.
Red luminescence intensity and experiment scheme of quadratic general rotary unitized design.
二次通用旋转组合设计的试验方案及红光发光强度
| ||||||||||||||||||||||||||||||||||||||||||||||||||||||||||||||||||||||||||||||||||||||||||||||||||||||||||||||||||||||||||||||||||
Table 4.
T-test and F-test with analysis of variance of red light
红光的T-检验及F-检验方差分析

Set citation alerts for the article
Please enter your email address
© Copyright 2018-2021 | Chinese Laser Press. All Rights Reserved 沪ICP备15018463号-20