
Xiaoping GU, Guangyi LI, Yuanhang CHEN, Yao LIAO. Temporal-spatial difference of pollutant gases in Guizhou Province based on OMI and ground data[J]. Journal of Atmospheric and Environmental Optics, 2024, 19(1): 85
- Journal of Atmospheric and Environmental Optics
- Vol. 19, Issue 1, 85 (2024)
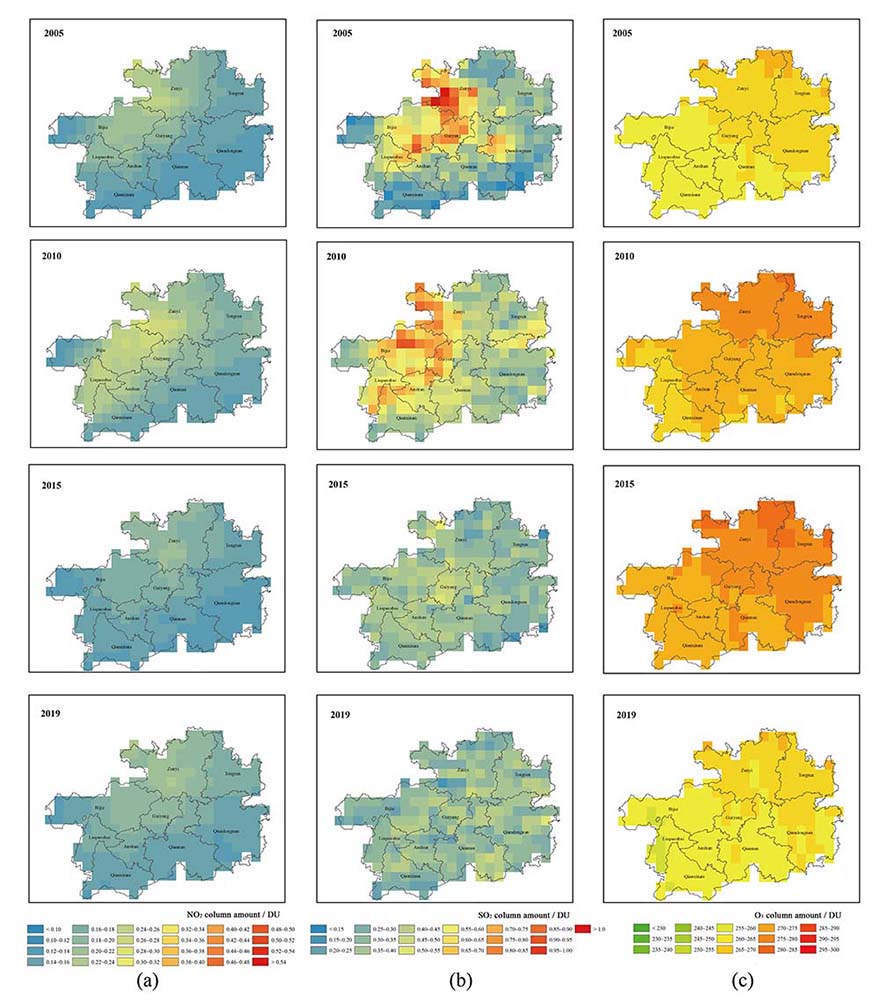
Fig. 1. Annual distribution characteristics of NO2 (a), SO2 (b), O3 (c) column amount based on OMI in Guizhou, China, in 2005, 2010, 2015 and 2019
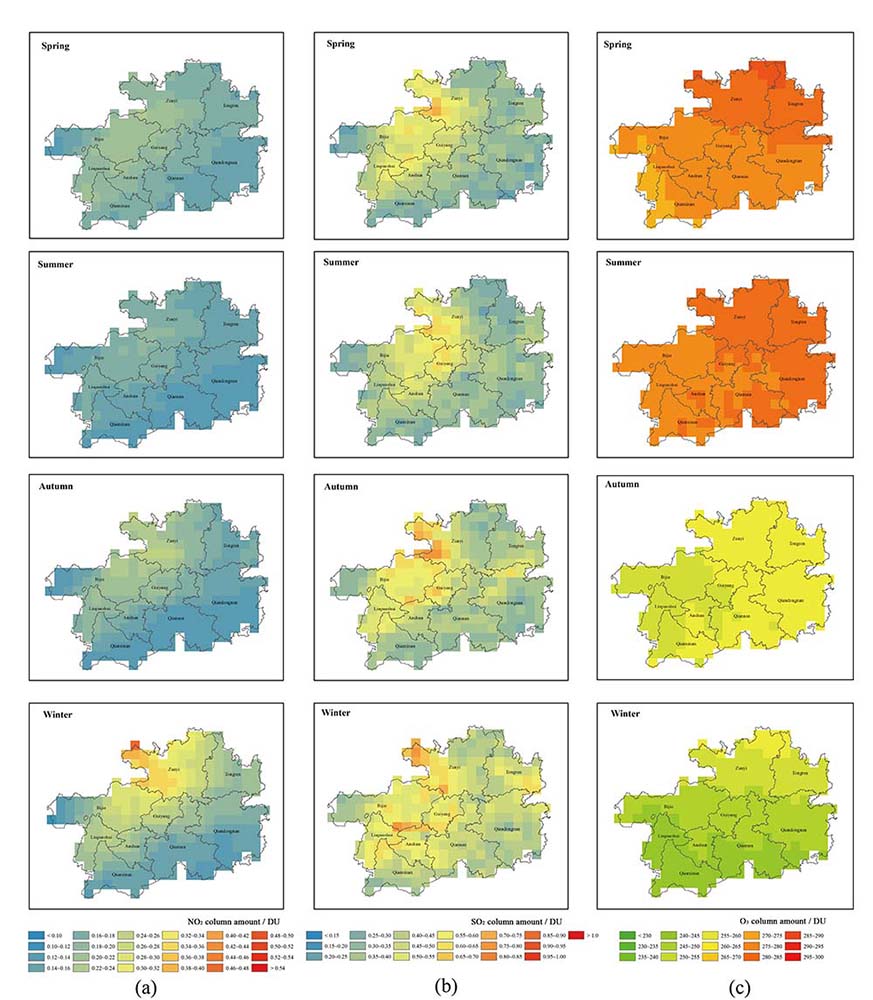
Fig. 2. Seasonal distribution characteristics of NO2 (a), SO2 (b), O3 (c) column amount based on OMI in Guizhou, China
Fig. 3. Monthly mean distribution characteristics of NO2 column amount in Guizhou based on OMI in the four years of 2005, 2010, 2015 and 2019
Fig. 4. Monthly average concentration statistics of NO2 in Guizhou based on ground monitoring stations from 2015 to 2019
Fig. 5. Monthly mean distribution characteristics of SO2 column amount in Guizhou based on OMI in the four years of 2005, 2010, 2015 and 2019
Fig. 6. Monthly average concentration statistics of SO2 in Guizhou based on ground monitoring stations from 2015 to 2019
Fig. 7. Monthly mean distribution characteristics of O3 column amount in Guizhou based on OMI in the four years of 2005, 2010, 2015 and 2019
Fig. 8. Monthly average concentration statistics of O3 in Guizhou based on ground monitoring stations from 2015 to 2019
| |||||||||||||||||||
Table 1. Temporal and spatial differences in monthly NO2 concentration monitored by two methods
| |||||||||||||||||||
Table 2. Temporal and spatial differences in monthly NO2 concentrations monitored by two methods
| |||||||||||||||||||
Table 3. Temporal and spatial differences in monthly O3 concentrations monitored by two methods


Set citation alerts for the article
Please enter your email address

© Copyright 2018-2021 | Chinese Laser Press. All Rights Reserved 沪ICP备15018463号-20