• Chinese Optics Letters
  • Vol. 21, Issue 6, 061401 (2023)
Aoran Feng1, Bowen Liu1、2、*, Dongyu Yan3、**, Genyu Bi1、2, Youjian Song1, and Minglie Hu1、2
Author Affiliations
  • 1Ultrafast Laser Laboratory, Key Laboratory of Opto-electronic Information Technology (Ministry of Education), School of Precision Instruments and Opto-electronics Engineering, Tianjin University, Tianjin 300072, China
  • 2Georgia Tech Shenzhen Institute, Tianjin University, Shenzhen 518055, China
  • 3Optoelectronic Detection and Processing Laboratory, School of Electronic Engineering, Tianjin University of Technology and Education, Tianjin 300222, China
  • show less
    DOI: 10.3788/COL202321.061401 Cite this Article Set citation alerts
    Aoran Feng, Bowen Liu, Dongyu Yan, Genyu Bi, Youjian Song, Minglie Hu. Sideband-free dispersion-managed Yb-doped mode-locked fiber laser with Gires–Tournois interferometer mirrors[J]. Chinese Optics Letters, 2023, 21(6): 061401 Copy Citation Text show less
    Numerical simulation model. Saturable absorber, SA; single-mode fiber, SMF; Yb-doped fiber, YDF; optical coupler, OC; GTIM1, GTI mirrors, which provide a GDD of −3000 fs2 per reflection; and GTIM2, GTI mirrors, which provide a GDD of −1000 fs2 per reflection.
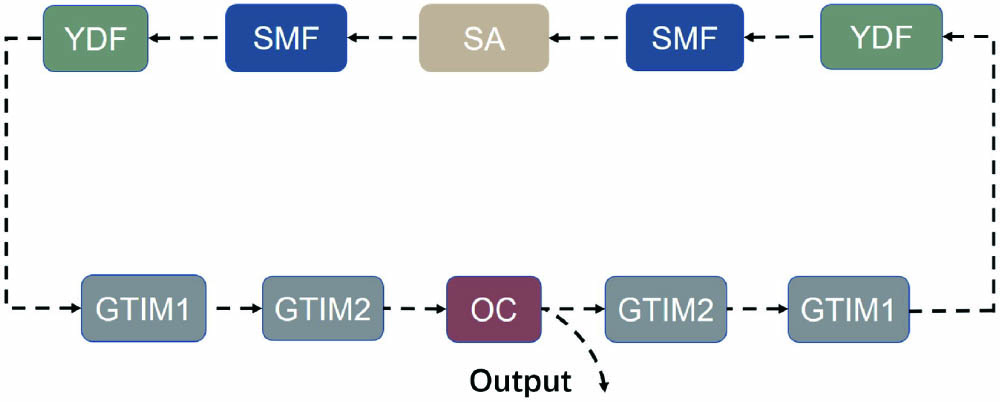
    Fig. 1. Numerical simulation model. Saturable absorber, SA; single-mode fiber, SMF; Yb-doped fiber, YDF; optical coupler, OC; GTIM1, GTI mirrors, which provide a GDD of −3000 fs2 per reflection; and GTIM2, GTI mirrors, which provide a GDD of −1000 fs2 per reflection.
    (a) NCD curve with GTIM1 (reflection for 6 times), GTIM2 (reflection for 18 times), and without the GTI mirrors. The NCD value is −0.0072 ps2 at 1030 nm after compensation. Inset: the GDD curve of GTIM1 and GTIM2. (b) Spectra when using GTIM1 and GTIM2 for dispersion compensation separately, whose NCD curves correspond to the red line and the black line in (a).
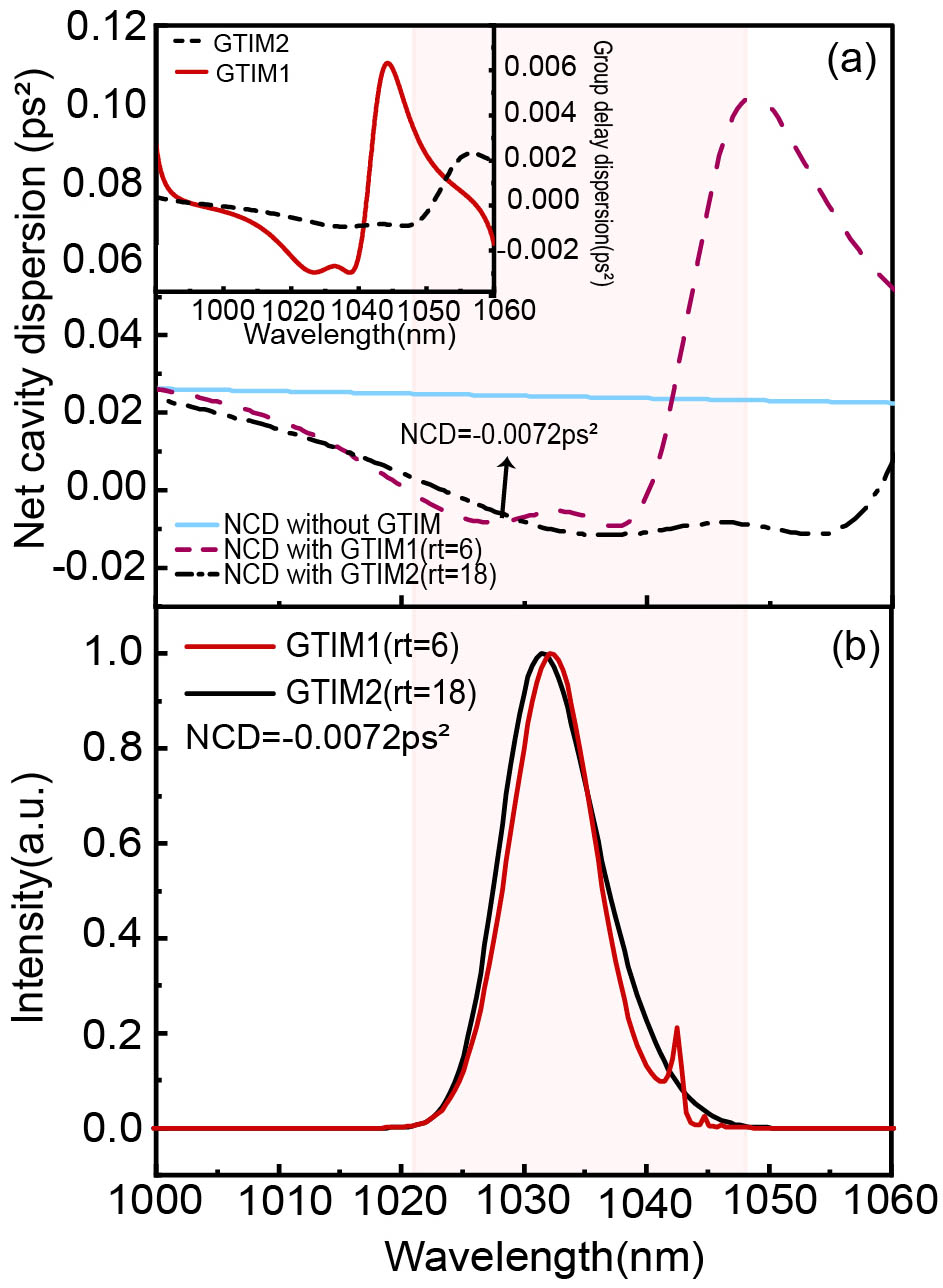
    Fig. 2. (a) NCD curve with GTIM1 (reflection for 6 times), GTIM2 (reflection for 18 times), and without the GTI mirrors. The NCD value is −0.0072 ps2 at 1030 nm after compensation. Inset: the GDD curve of GTIM1 and GTIM2. (b) Spectra when using GTIM1 and GTIM2 for dispersion compensation separately, whose NCD curves correspond to the red line and the black line in (a).
    Simulation results. (a) The spectra at different NCD. Times_2 represents the reflection times of GTIM2. (b) The ratio of the NCD to the NTOD versus Times_2, which corresponds to (a). (c) The spectra at different gain saturation energies Esat. (d) The spectra at different transmission coefficients of the output mirror.
    Fig. 3. Simulation results. (a) The spectra at different NCD. Times_2 represents the reflection times of GTIM2. (b) The ratio of the NCD to the NTOD versus Times_2, which corresponds to (a). (c) The spectra at different gain saturation energies Esat. (d) The spectra at different transmission coefficients of the output mirror.
    Configuration of the dispersion-managed mode-locked fiber laser with GTI mirrors. Laser diode, LD; wavelength division multiplexer, WDM; Yb-doped fiber, YDF; single-mode fiber, SMF; semiconductor saturable absorber mirror, SESAM; half-wave plate, HWP; GTIM1, GTI mirrors of −3000 fs2; and GTIM2, GTI mirrors of −1000 fs2; output coupler, OC.
    Fig. 4. Configuration of the dispersion-managed mode-locked fiber laser with GTI mirrors. Laser diode, LD; wavelength division multiplexer, WDM; Yb-doped fiber, YDF; single-mode fiber, SMF; semiconductor saturable absorber mirror, SESAM; half-wave plate, HWP; GTIM1, GTI mirrors of −3000 fs2; and GTIM2, GTI mirrors of −1000 fs2; output coupler, OC.
    Experimental results. (a) The spectra at different NCD values. Times_2 represents the reflection times of GTIM2. (b) The spectra under different pump powers. (c) The spectra under different transmission coefficients.
    Fig. 5. Experimental results. (a) The spectra at different NCD values. Times_2 represents the reflection times of GTIM2. (b) The spectra under different pump powers. (c) The spectra under different transmission coefficients.
    Mode-locked fiber laser output characteristics at 90 mW pump power. (a) The spectrum in the linear scale (the inset is the spectrum in the logarithmic scale), (b) the intensity autocorrelation trace, (c) the output RF spectrum, and (d) the typical pulse train.
    Fig. 6. Mode-locked fiber laser output characteristics at 90 mW pump power. (a) The spectrum in the linear scale (the inset is the spectrum in the logarithmic scale), (b) the intensity autocorrelation trace, (c) the output RF spectrum, and (d) the typical pulse train.
    Output Coupling RatioSpectral Width (nm)Pump Power Range of Mode-locking (mW)Output Power (mW) Pp = 90 mW
    5%8.9860–1700.93
    10%8.7660–1851.81
    20%8.5070–2003.99
    Table 1. Summary of the Output Laser Parameters under Different Transmission Coefficients of the Output Mirror
    Aoran Feng, Bowen Liu, Dongyu Yan, Genyu Bi, Youjian Song, Minglie Hu. Sideband-free dispersion-managed Yb-doped mode-locked fiber laser with Gires–Tournois interferometer mirrors[J]. Chinese Optics Letters, 2023, 21(6): 061401
    Download Citation