• Resources Science
  • Vol. 42, Issue 5, 840 (2020)
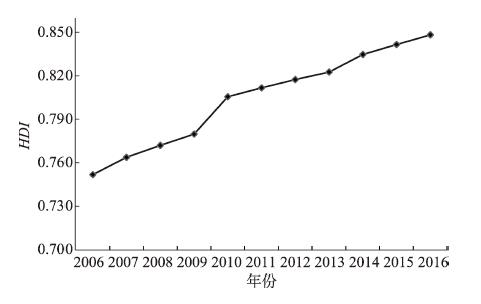
Shengyun WANG1、2, Yajie HAN3, Huimin REN2, and Jing Li1、2、*
Author Affiliations
  • 1Research Center of Central China Economic Development, Nanchang University, Nanchang 330047, China;
  • 2School of Economics and Management, Nanchang University, Nanchang 330031, China;
  • 3School of Tourism, Nanchang University, Nanchang 330031, China
  • show less
    DOI: 10.18402/resci.2020.05.04 Cite this Article
    Shengyun WANG, Yajie HAN, Huimin REN, Jing Li. Evaluation of provincial ecological well-being performance and its driving effect decomposition in China[J]. Resources Science, 2020, 42(5): 840 Copy Citation Text show less
    Human development index (HDI) change of China, 2006-2016
    Fig. 1. Human development index (HDI) change of China, 2006-2016
    Spatial structure change of human development index (HDI) of some Chinese provinces, 2006 and 2016
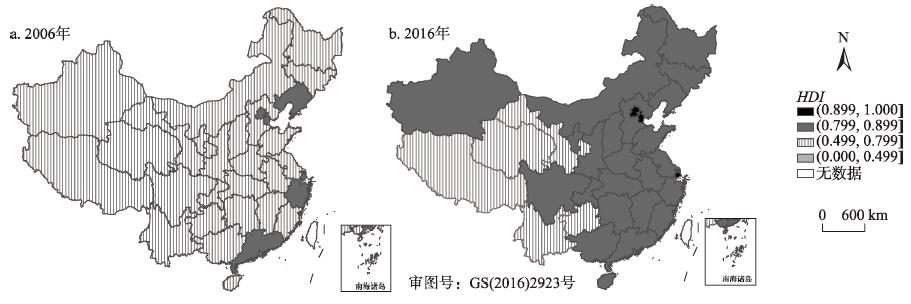
    Fig. 2. Spatial structure change of human development index (HDI) of some Chinese provinces, 2006 and 2016
    Change of per capita ecological footprint (EF) and its compositions in China, 2006-2016
    Fig. 3. Change of per capita ecological footprint (EF) and its compositions in China, 2006-2016
    Spatial structure of per capita ecological footprint (EF) in some Chinese provinces, 2006 and 2016
    Fig. 4. Spatial structure of per capita ecological footprint (EF) in some Chinese provinces, 2006 and 2016
    因子耕地林地草地建设用地渔业用地化石燃料用地
    等价因子2.211.340.492.210.201.34
    产量因子2.801.100.502.800.201.10
    Table 1. Land equivalent factor and production factor
    2006年2007年2008年2009年2010年2011年2012年2013年2014年2015年2016年年均增长率/%
    全国3.012.882.792.722.622.432.392.402.422.432.44-2.12
    北京3.543.583.623.784.024.374.454.895.155.375.896.65
    天津2.172.172.292.252.041.962.032.052.242.342.551.74
    河北2.512.382.332.242.191.981.981.992.082.122.20-1.22
    上海2.662.772.682.82.692.662.742.642.962.893.181.96
    江苏2.892.802.752.712.572.332.302.272.302.252.26-2.18
    浙江2.892.882.852.812.782.642.712.702.742.722.88-0.02
    福建2.862.912.862.652.652.452.462.502.322.342.48-1.35
    山东2.272.162.062.031.981.911.851.941.871.821.82-1.96
    广东3.883.923.843.703.513.333.393.443.513.563.64-0.61
    海南2.502.282.212.162.212.031.982.041.941.881.99-2.02
    辽宁1.721.721.671.641.571.481.441.471.501.521.54-1.02
    吉林2.542.692.392.472.302.042.062.082.112.192.28-1.04
    黑龙江2.602.532.292.242.121.981.931.981.921.921.94-2.55
    山西1.401.371.431.471.461.351.301.271.251.271.33-0.51
    安徽3.993.913.623.433.343.253.132.992.882.903.04-2.38
    江西4.374.304.264.194.043.823.773.663.533.453.63-1.70
    河南3.583.373.353.333.203.003.163.163.113.093.22-1.01
    湖北3.353.193.203.092.922.702.652.922.842.873.02-0.98
    湖南4.174.004.003.893.993.703.693.843.813.743.93-0.57
    广西3.112.982.953.002.842.632.482.502.512.622.77-1.09
    重庆4.944.194.073.933.693.573.624.033.853.834.17-1.57
    四川4.954.624.464.204.264.244.174.123.924.114.40-1.12
    贵州2.852.902.952.802.952.822.632.612.762.762.76-0.32
    云南3.343.233.113.033.163.053.013.053.473.743.731.17
    西藏7.468.4516.6117.8618.4110.4511.5412.1610.5910.7810.564.15
    陕西3.693.423.193.022.722.522.252.222.122.142.11-4.28
    甘肃3.303.163.173.303.172.872.822.742.842.883.08-0.66
    青海3.272.722.672.722.882.582.252.122.412.592.39-2.69
    宁夏1.511.431.371.301.180.930.890.860.850.830.91-3.97
    新疆2.001.951.861.691.641.451.291.191.111.121.16-4.20
    内蒙古1.291.231.071.041.010.830.810.830.810.820.86-3.32
    Table 2. Ecological well-being performance (EWP) change of some Chinese provinces, 2006-2016
    类型划分标准省份
    低福祉增长0DI0.1北京、天津、河北、辽宁、吉林、上海、江苏、浙江、福建、广东、山东、河南、湖北、重庆、四川、陕西、安徽、江西、湖南、山西
    中福祉增长0.1<DI<1内蒙古、黑龙江、广西、海南、贵州、甘肃、青海、宁夏、新疆、西藏、云南
    高福祉增长DI1
    福祉负增长DI<0
    Table 3. Classification of well-being effect of economic growth in some Chinese provinces
    全要素生产率TFP绿色全要素生产率GTFP
    2006—2007年2015—2016年2006—2007年2015—2016年
    TECHSECHPECHTFPTECHSECHPECHTFPTECHSECHPECHGTFPTECHSECHPECHGTFP
    全国1.0661.0691.7872.0361.4601.5090.6631.4600.9571.2681.5241.8491.3701.5090.6631.370
    北京1.0191.1681.0361.2331.5550.7881.2701.5551.0351.1951.0331.1751.0531.0011.0001.053
    天津0.9940.7121.5671.2031.3601.0380.9631.3591.1241.0041.0471.1811.2870.7471.3381.287
    河北1.0131.2591.1051.4099.8530.1466.8429.8530.9301.5670.8991.3094.0800.2084.8154.080
    山西1.0331.2051.1281.4042.9871.1800.8472.9850.9331.2051.1731.3202.6430.5971.6752.643
    内蒙古1.0700.9541.0001.0210.1357.6020.1320.1351.0541.0331.0001.0880.1657.6020.1320.165
    辽宁1.0071.1611.1431.3361.0001.0001.0001.0000.9241.4680.9561.2971.0001.0001.0001.000
    吉林1.0631.1781.2381.5518.9360.6111.6378.9360.9471.7551.0081.6751.1251.4960.6691.125
    黑龙江1.0641.0751.0781.2341.0003.5620.2811.0000.9461.4260.8781.1841.0003.2140.3111.000
    上海1.0131.1601.0001.1760.9100.9011.1100.9101.1131.0011.0001.1140.9100.9011.1100.910
    江苏1.0471.3040.8521.1631.5700.8731.1461.5701.0011.3540.8511.1541.4490.8731.1461.449
    浙江0.9791.1781.0321.1902.3480.7961.2572.3481.0161.1441.0231.1901.9990.7971.2551.999
    安徽1.0450.9521.0201.0152.1140.8261.2102.1140.9661.1350.9481.0402.8500.8261.2102.850
    福建1.0300.7291.2440.9343.1200.8801.1373.1200.9431.0340.9730.9482.6310.8801.1372.631
    江西1.0181.1391.0181.1812.3630.7781.2862.3630.9541.2910.9501.1693.4000.7791.2843.400
    山东1.0611.2271.0221.3302.8311.0090.9922.8311.0421.2071.0141.2752.2741.0090.9922.274
    河南1.0851.1550.9241.1581.9010.6891.4511.9010.9791.2970.8861.1242.2280.7261.3772.228
    湖北1.0340.9341.1831.1421.6590.9061.1031.6590.9661.1880.9671.1093.8600.9061.1033.860
    湖南1.0240.8441.0480.9061.9051.0001.0001.9050.9421.0720.8610.8703.5411.0001.0003.541
    广东0.9240.9850.8170.7432.6170.6661.5012.6170.9140.9850.9030.8142.2180.6821.4662.218
    广西1.0711.1241.0651.2833.0270.8271.2093.0270.9901.2930.9681.2381.2791.2060.8291.279
    海南1.0361.0450.6740.7302.6700.5271.8982.6701.0361.0590.6910.7582.1680.5401.8512.168
    重庆1.0000.6840.7080.4842.0670.9191.0882.0671.0000.7710.7080.5461.7780.9191.0881.778
    四川1.0830.9521.0261.0581.0001.1720.8541.0001.0121.1350.8851.0171.0001.0390.9631.000
    贵州1.0001.0001.0001.0001.0631.0570.9461.0631.0001.0001.0001.0001.0121.0570.9461.012
    云南1.0201.0741.0631.1653.0750.8301.2053.0750.9561.2571.0951.3160.4771.0290.9710.477
    西藏1.9510.9150.8001.4291.5010.8611.1621.5011.9041.0001.0001.9041.2550.8611.1621.255
    陕西1.0560.9020.8220.7835.3440.2753.6325.3441.0161.0020.8260.8413.3390.2793.5893.339
    甘肃1.0100.7810.9140.7212.2410.6381.5662.2400.9560.8410.8670.6971.3860.2763.6221.386
    青海1.1231.0451.0751.2613.2650.4702.1273.2651.1231.0451.0751.2610.4211.0001.0000.421
    宁夏0.8201.0001.0000.8202.4270.6561.5242.4270.8201.0001.0000.8202.0470.6481.5442.047
    新疆1.0351.0860.8510.9562.2500.8351.1982.2501.0371.1130.8450.9751.9590.8351.1981.959
    Table 4. Comparison of total factor productivity (TFP) and green total factor productivity (GTFP) in some Chinese provinces
    类型特征省份
    经济主导提升型低福祉增长、高绿色全要素生产率、生态福利绩效提升北京、天津、上海
    福祉带动提升型中福祉增长、低绿色全要素生产率、生态福利绩效提升云南、西藏
    福祉滞后下降型低福祉增长、高绿色全要素生产率、生态福利绩效下降辽宁、河北、江苏、浙江、福建、广东、山东、河南、湖北、四川、陕西、安徽、湖南、江西
    经济滞后下降型中福祉增长、低绿色全要素生产率、生态福利绩效下降海南、广西、贵州、甘肃、青海、宁夏、新疆、黑龙江、内蒙古
    总体下降型低福祉增长、低绿色全要素生产率、生态福利绩效下降吉林、山西、重庆
    Table 5. Ecological well-being performance (EWP) types of some Chinese provinces
    Shengyun WANG, Yajie HAN, Huimin REN, Jing Li. Evaluation of provincial ecological well-being performance and its driving effect decomposition in China[J]. Resources Science, 2020, 42(5): 840
    Download Citation