• Chinese Optics Letters
  • Vol. 20, Issue 9, 091603 (2022)
Xin Huang1、2, Jin He1、3, Yiguang Jiang1, Zhuocheng Chen4, Xing Duan1、5、*, and Long Zhang1、3、6、**
Author Affiliations
  • 1CAS Key Laboratory of Materials for High Power Laser, Shanghai Institute of Optics and Fine Mechanics, Chinese Academy of Sciences, Shanghai 201800, China
  • 2College of Materials Science and Optoelectronics Engineering, University of Chinese Academy of Sciences (UCAS), Beijing 100049, China
  • 3Hangzhou Institute for Advanced Study, UCAS, Hangzhou 310024, China
  • 4School of Materials and Chemistry, University of Shanghai for Science and Technology, Shanghai 200093, China
  • 5Center of Advanced Optoelectronic Materials and Devices, Key Laboratory of Novel Materials for Sensor of Zhejiang Province, College of Materials and Environmental Engineering, Hangzhou Dianzi University, Hangzhou 310018, China
  • 6Collaborative Innovation Center of IFSA (CICIFSA), Shanghai Jiao Tong University, Shanghai 200240, China
  • show less
    DOI: 10.3788/COL202220.091603 Cite this Article Set citation alerts
    Xin Huang, Jin He, Yiguang Jiang, Zhuocheng Chen, Xing Duan, Long Zhang. Structural and optical properties evolution in pressure-induced amorphization of metal-organic framework ZIF-8[J]. Chinese Optics Letters, 2022, 20(9): 091603 Copy Citation Text show less
    PXRD patterns of ZIF-8 under different pressure.
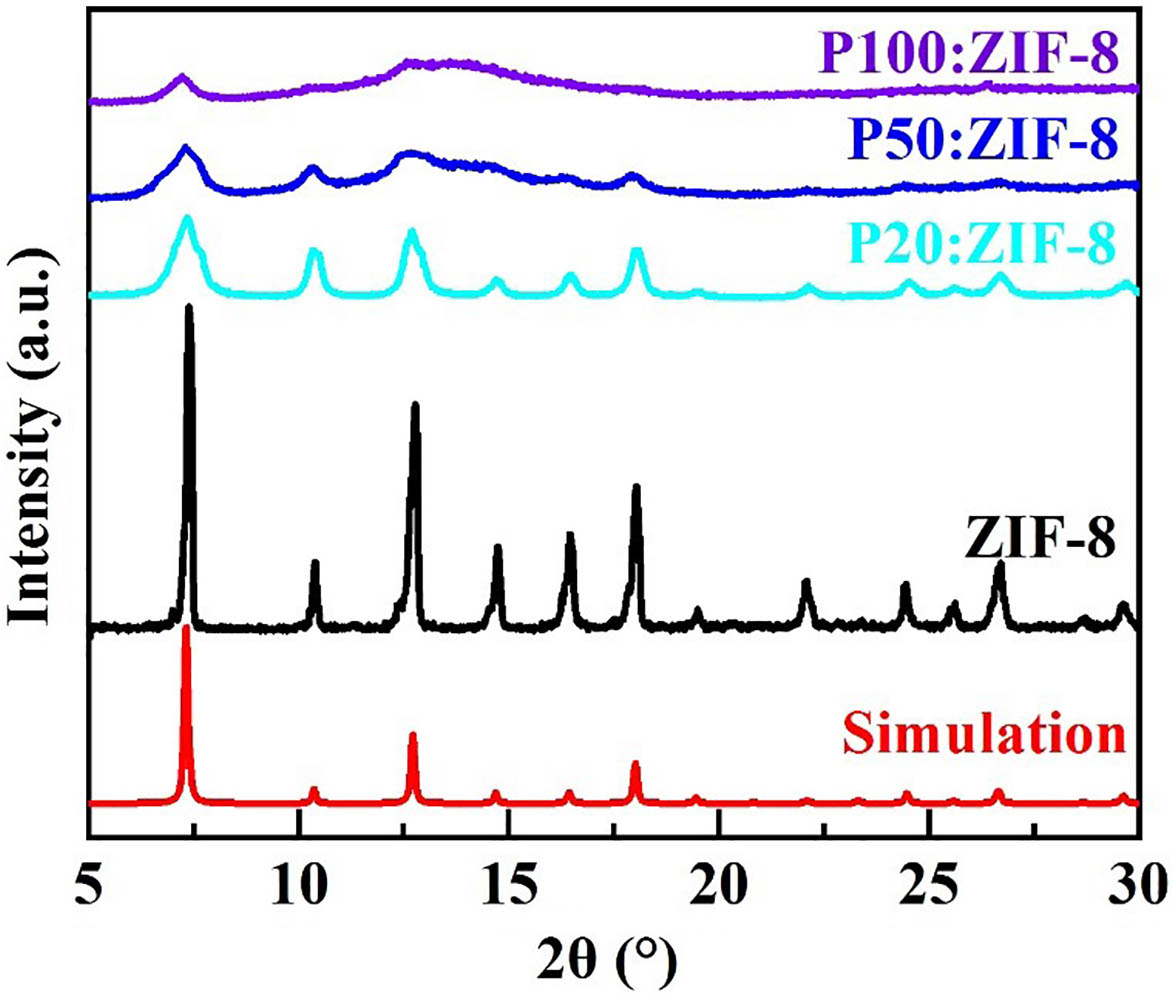
    Fig. 1. PXRD patterns of ZIF-8 under different pressure.
    SEM images and elemental distribution of ZIF-8 (a) before and (b) after pressurization. The atomic percentage of each element is shown at the bottom right of the images.
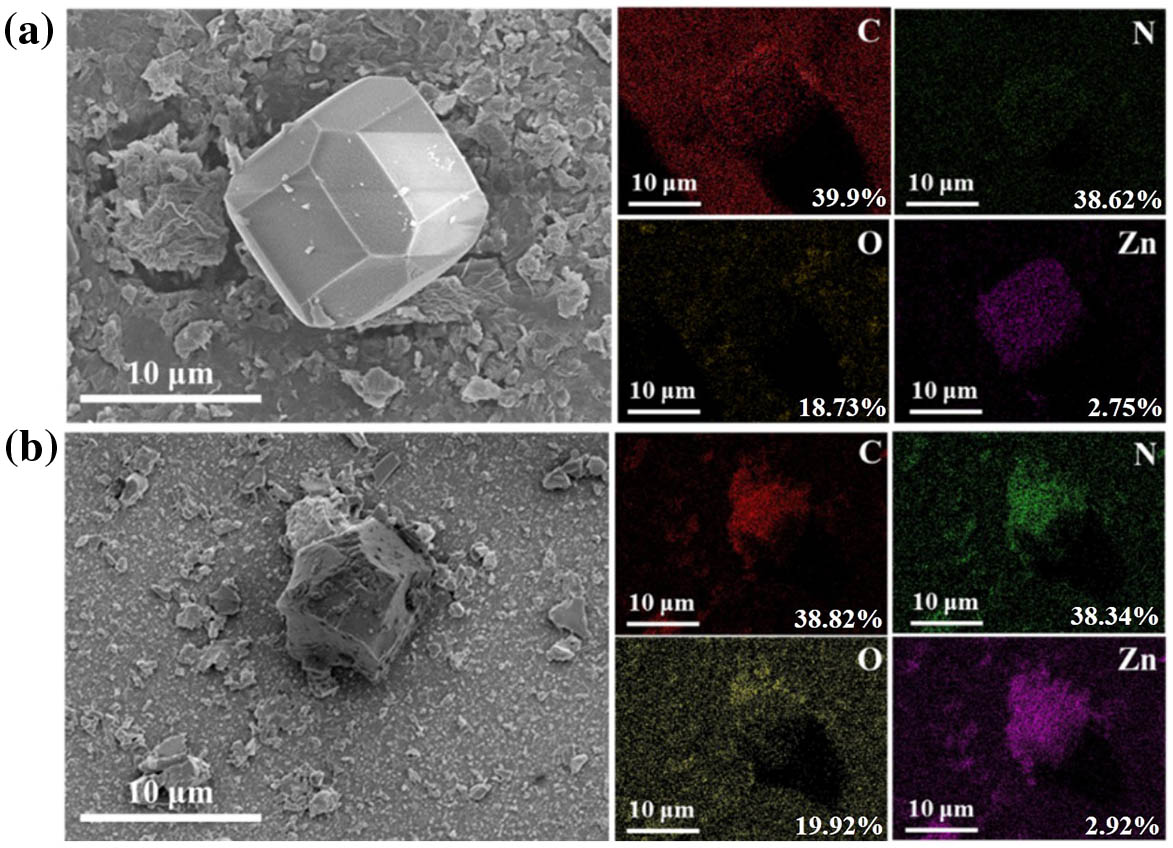
    Fig. 2. SEM images and elemental distribution of ZIF-8 (a) before and (b) after pressurization. The atomic percentage of each element is shown at the bottom right of the images.
    N2 adsorption isotherms for ZIF-8 before (black) and after (blue) pressurization. Solid circles indicate adsorption, while hollow circles indicate desorption.
    Fig. 3. N2 adsorption isotherms for ZIF-8 before (black) and after (blue) pressurization. Solid circles indicate adsorption, while hollow circles indicate desorption.
    SHG signal of ZIF-8 under different pressure excited by IR laser radiation (1030 nm central wavelength, 150 fs pulse duration, 50 mW, 80 MHz repetition rate).
    Fig. 4. SHG signal of ZIF-8 under different pressure excited by IR laser radiation (1030 nm central wavelength, 150 fs pulse duration, 50 mW, 80 MHz repetition rate).
    SEM images and elemental distribution of Eu at ZIF-8 (a) before and (b) after pressurization. The atomic percentage of each element is shown at the bottom right of the images.
    Fig. 5. SEM images and elemental distribution of Eu at ZIF-8 (a) before and (b) after pressurization. The atomic percentage of each element is shown at the bottom right of the images.
    (a) PXRD patterns and (b) N2 adsorption isotherms of Eu at ZIF-8 before and after pressurization.
    Fig. 6. (a) PXRD patterns and (b) N2 adsorption isotherms of Eu at ZIF-8 before and after pressurization.
    PL spectra for Eu at ZIF-8 before (black) and after (blue) pressurization.
    Fig. 7. PL spectra for Eu at ZIF-8 before (black) and after (blue) pressurization.
    Xin Huang, Jin He, Yiguang Jiang, Zhuocheng Chen, Xing Duan, Long Zhang. Structural and optical properties evolution in pressure-induced amorphization of metal-organic framework ZIF-8[J]. Chinese Optics Letters, 2022, 20(9): 091603
    Download Citation