• High Power Laser Science and Engineering
  • Vol. 8, Issue 4, 04000e31 (2020)
Mario Galletti1、2、3、*, Pedro Oliveira2, Marco Galimberti2, Munadi Ahmad2、4, Giedre Archipovaite2, Nicola Booth2, Emerald Dilworth2, Andy Frackiewicz2, Trevor Winstone2, Ian Musgrave2, and Cristina Hernandez-Gomez2
Author Affiliations
  • 1GoLP/Instituto de Plasmas e Fusão Nuclear, Instituto Superior Tecnico, Universidade de Lisboa, 1049-001 Lisboa, Portugal
  • 2Central Laser Facility, Science and Technology Facilities Council, Rutherford Appleton Laboratory, Harwell Science and Innovation Campus, Didcot, UK
  • 3INFN-LNF, Via Enrico Fermi 54, 00044Frascati, Italy
  • 4School of Engineering and Physical Sciences, Heriot-Watt University, Edinburgh, UK
  • show less
    DOI: 10.1017/hpl.2020.31 Cite this Article Set citation alerts
    Mario Galletti, Pedro Oliveira, Marco Galimberti, Munadi Ahmad, Giedre Archipovaite, Nicola Booth, Emerald Dilworth, Andy Frackiewicz, Trevor Winstone, Ian Musgrave, Cristina Hernandez-Gomez. Ultra-broadband all-OPCPA petawatt facility fully based on LBO[J]. High Power Laser Science and Engineering, 2020, 8(4): 04000e31 Copy Citation Text show less
    Sketch of the Vulcan OPPEL laser system.
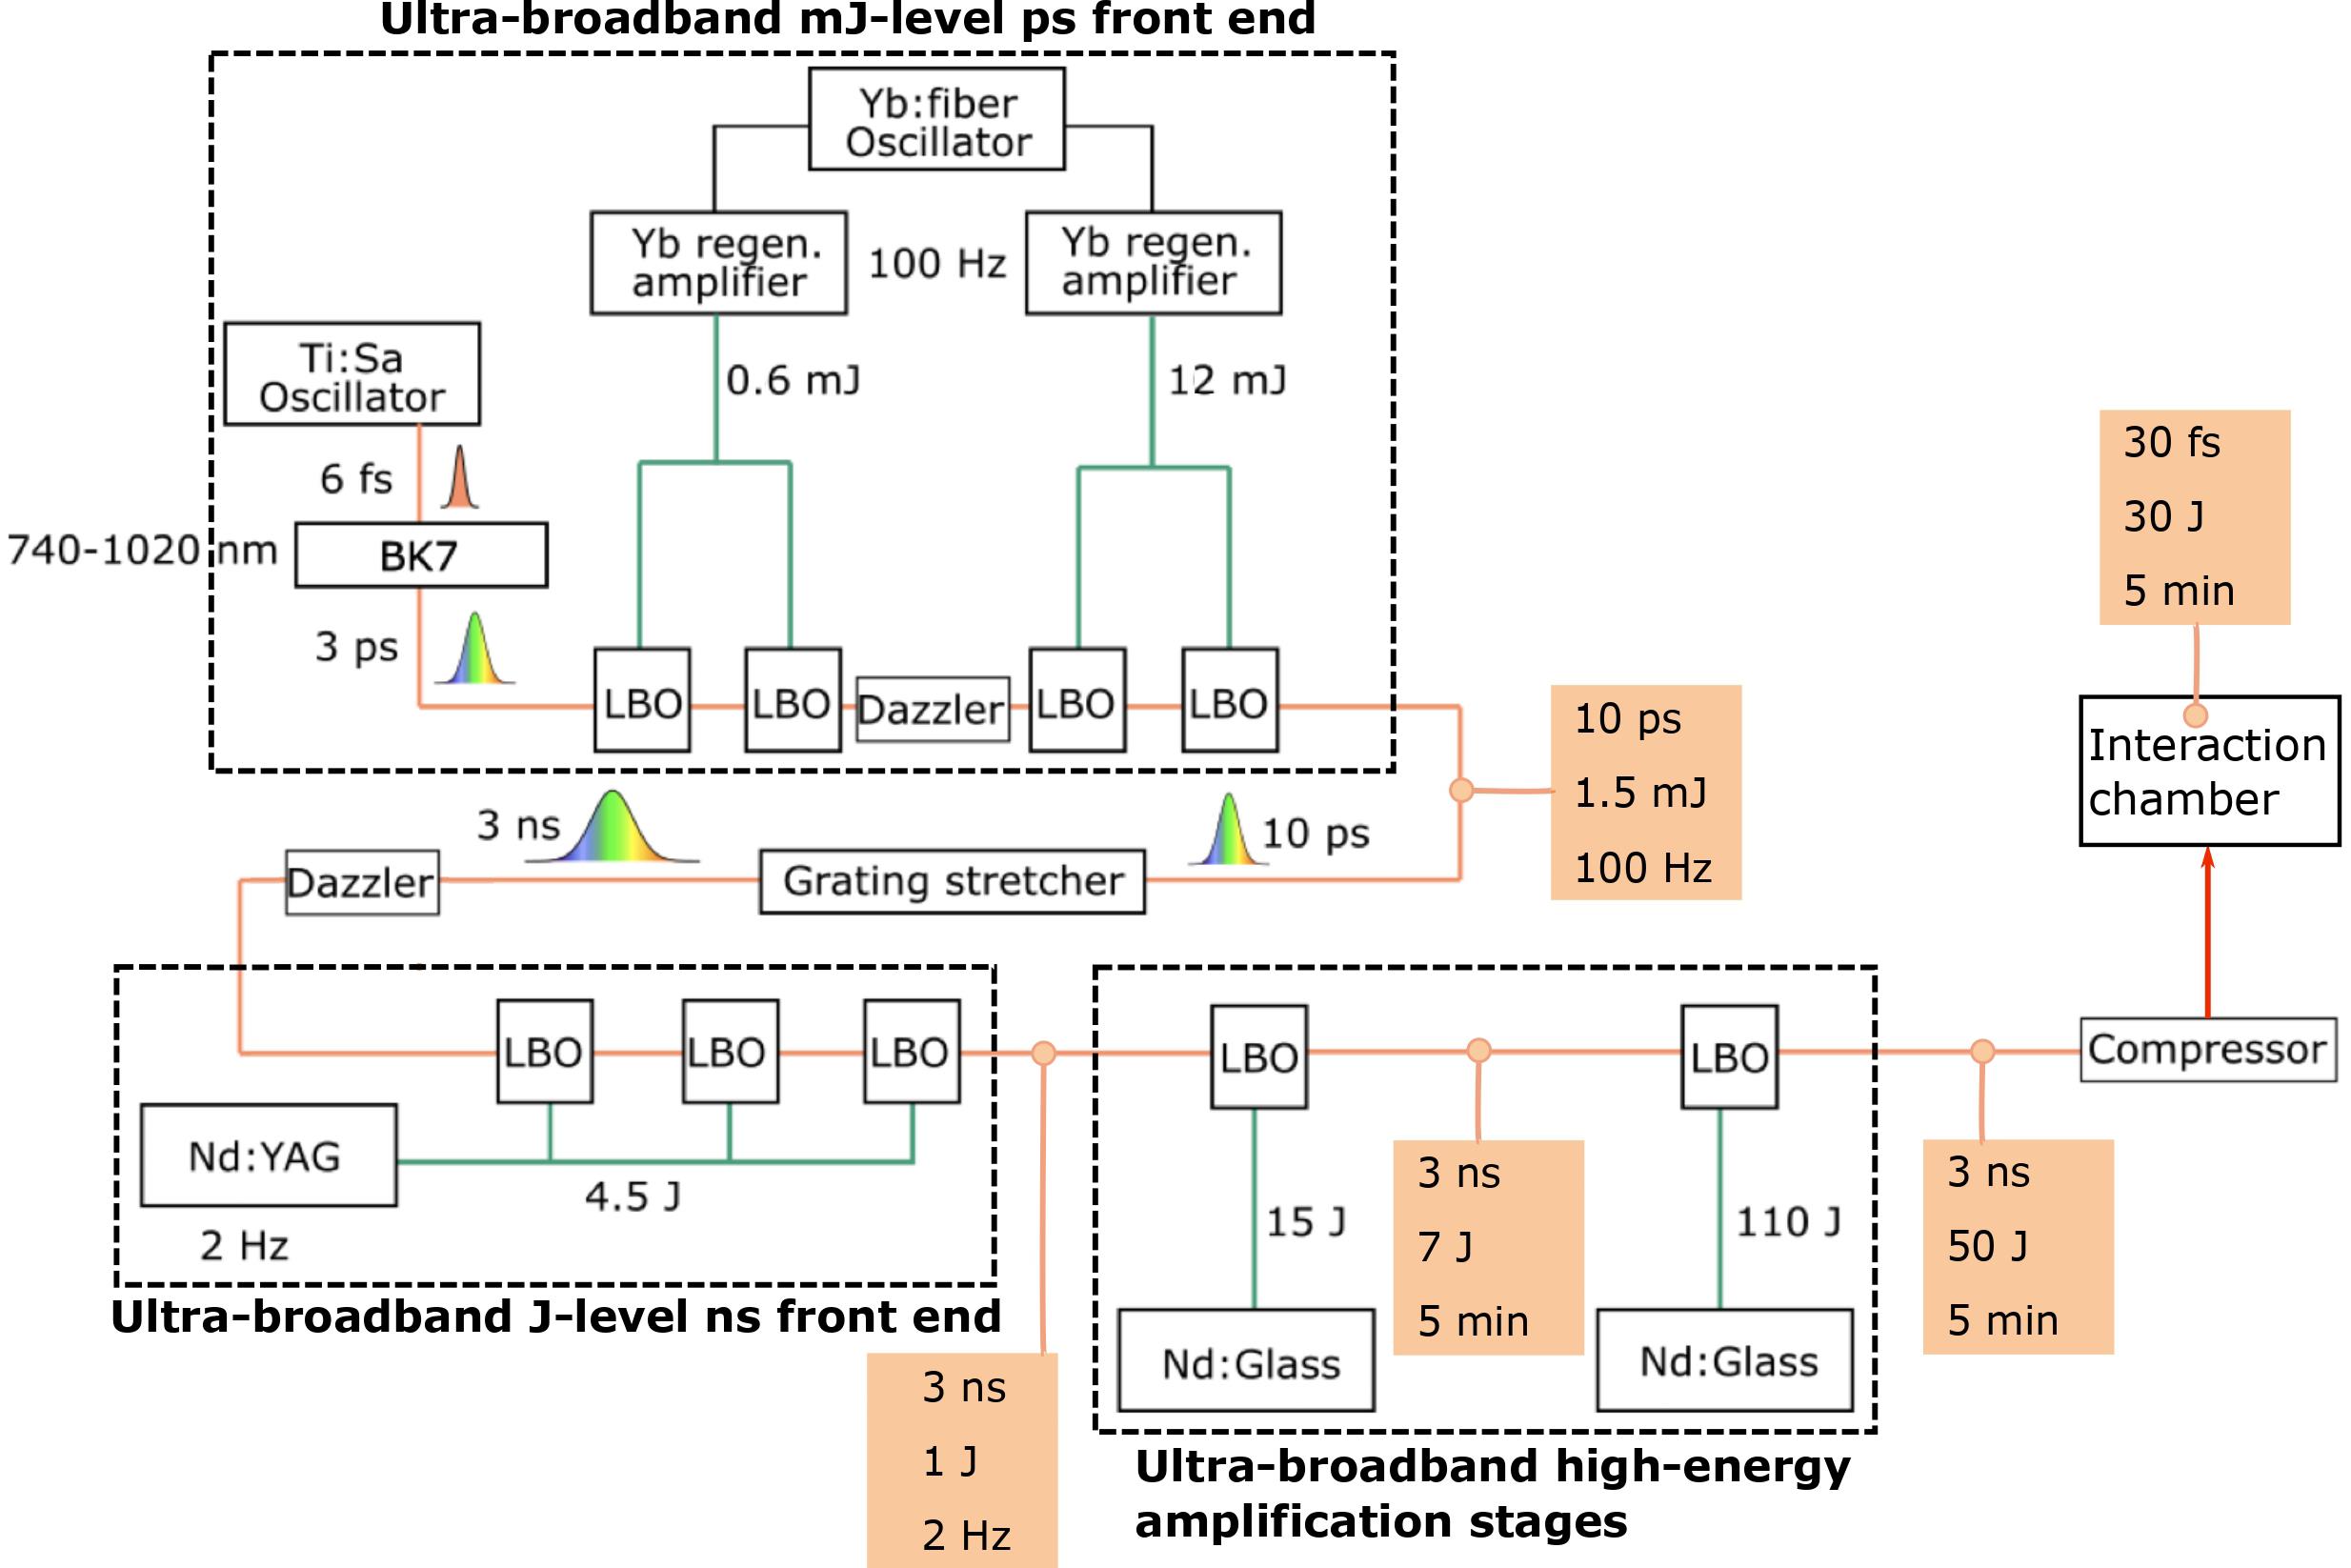
    Fig. 1. Sketch of the Vulcan OPPEL laser system.
    Simulated spectra at each stage of the system with LBO and the front end with BBO.
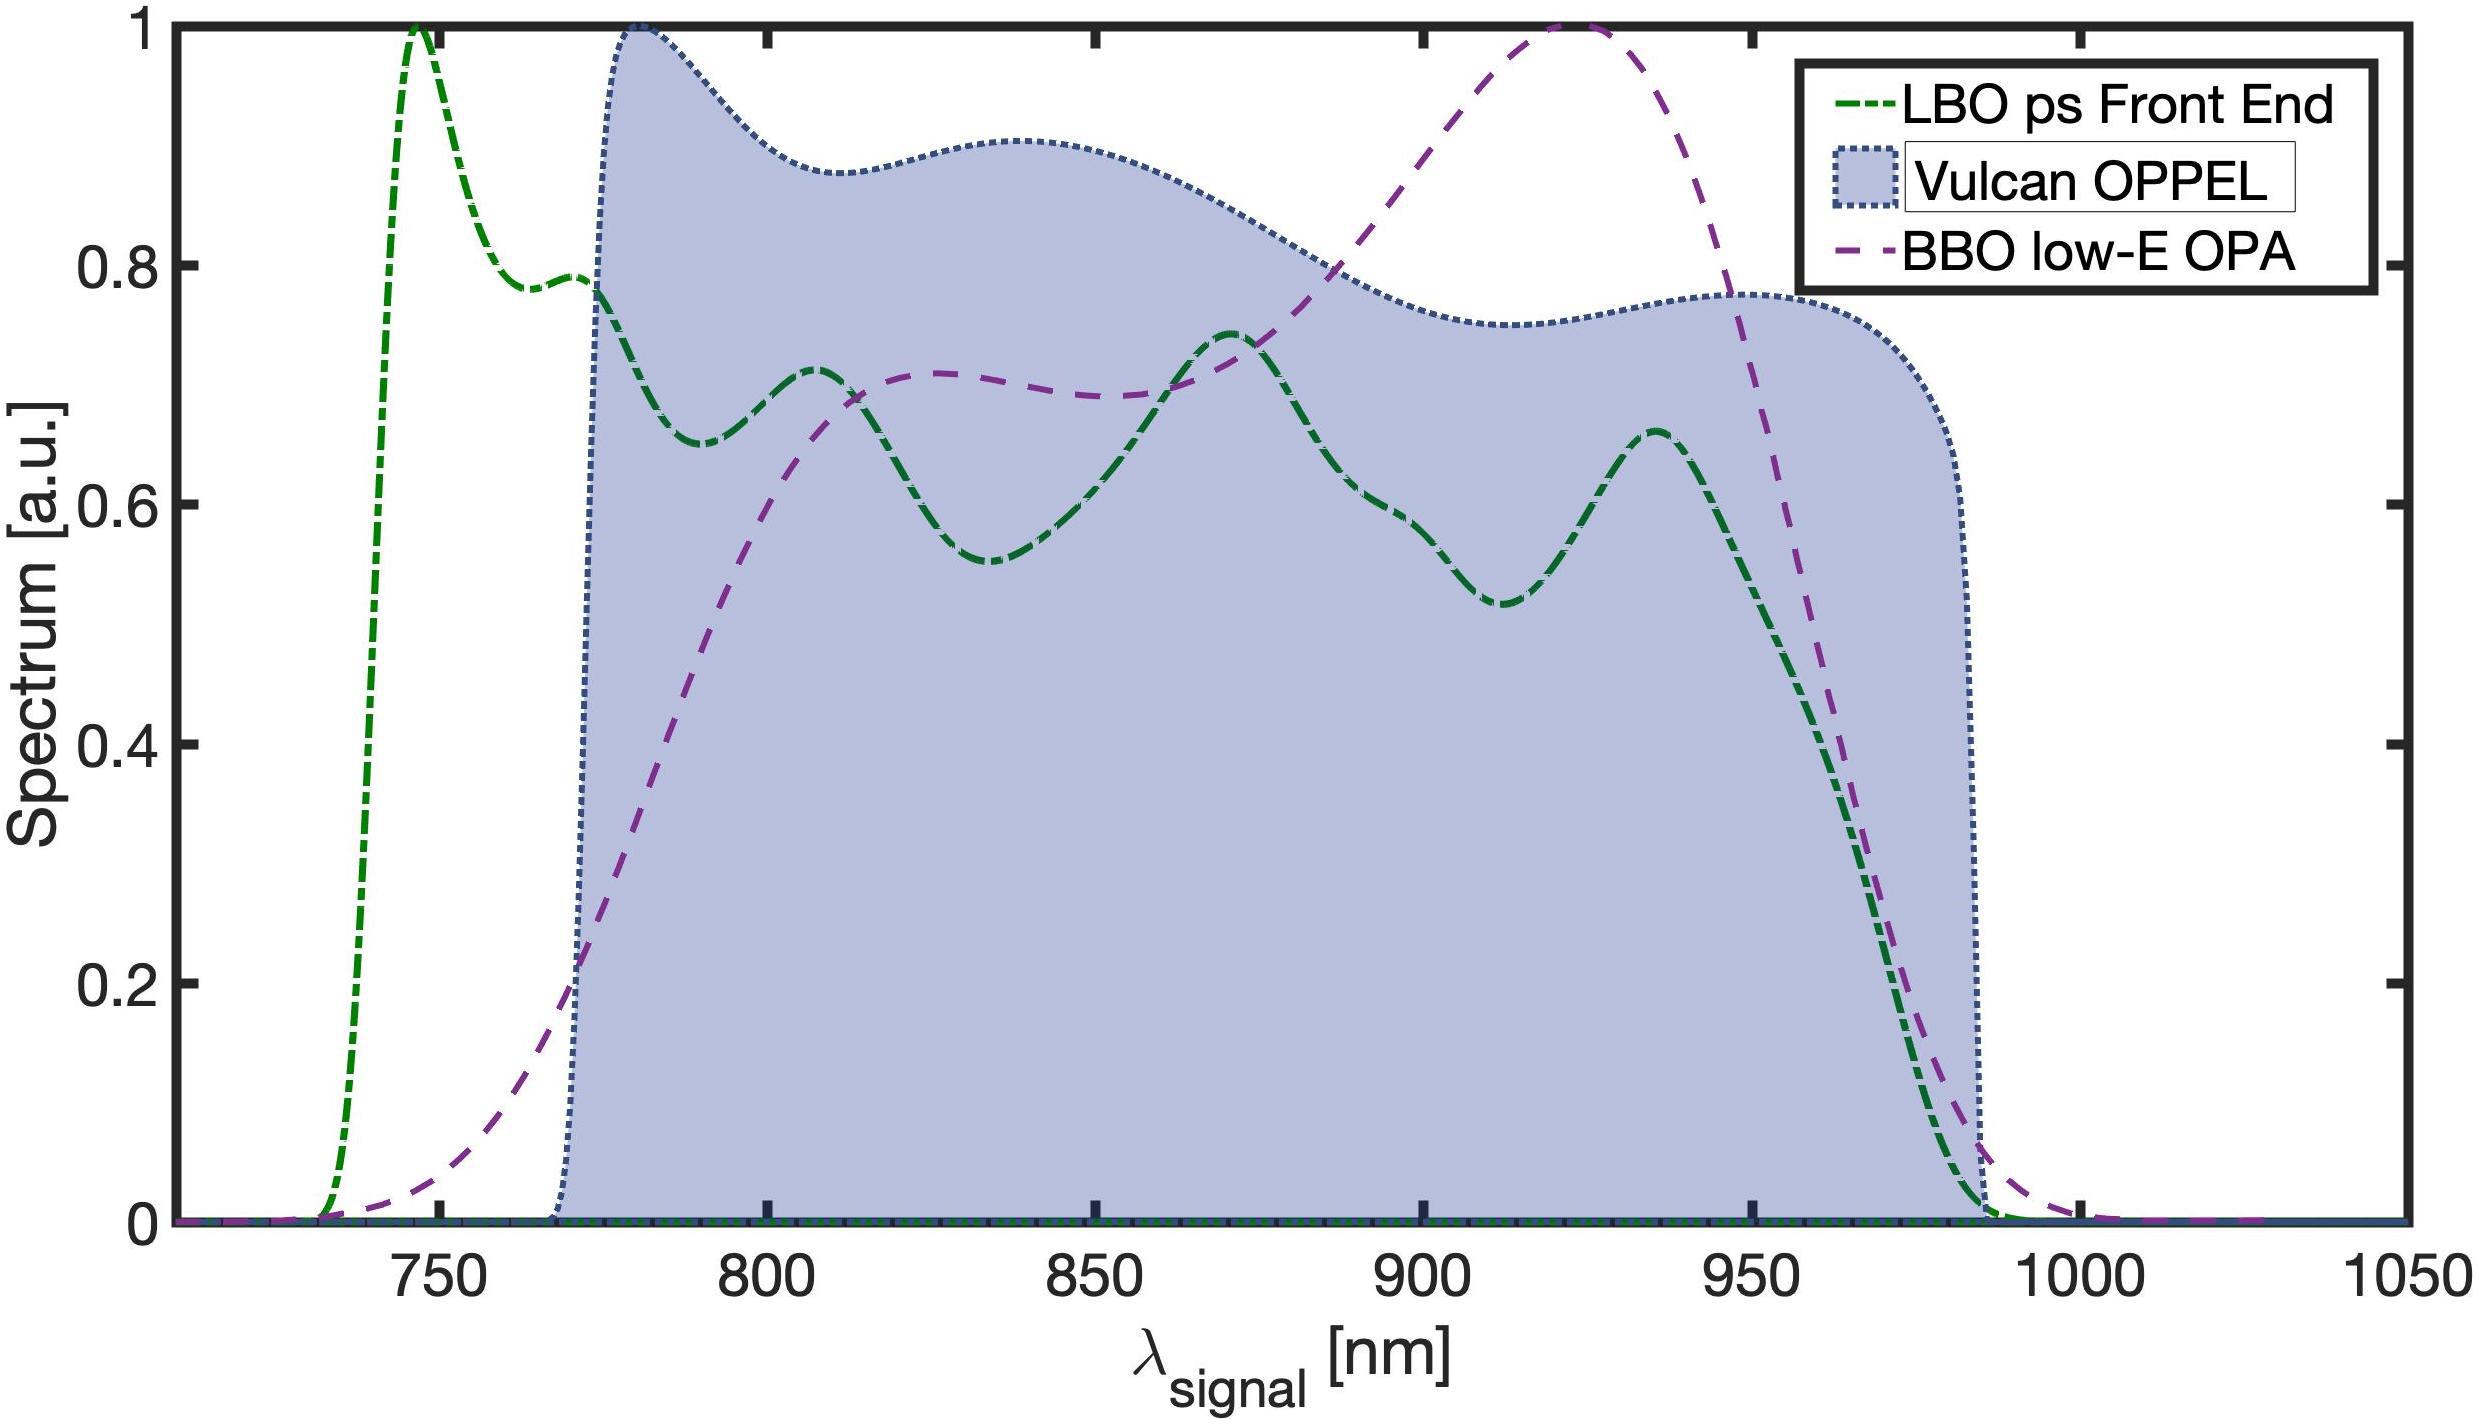
    Fig. 2. Simulated spectra at each stage of the system with LBO and the front end with BBO.
    Simulated spectra at each stage of the system compared with the expected efficiency of the compressor.
    Fig. 3. Simulated spectra at each stage of the system compared with the expected efficiency of the compressor.
    Measured spectrum of the Ti:sapphire system showing intensity modulation.
    Fig. 4. Measured spectrum of the Ti:sapphire system showing intensity modulation.
    Sketch of the picosecond mJ-level front end experimental setup. The commercial Ti:sapphire oscillator (Venteon) and the two commercial RGAs (S-pulse and Magma25) are seeding and pumping the four NOPA stages, respectively. The compact seed stretcher is made by two BK7 glass blocks, as shown below the Venteon box. The violet dashed boxes are hybrid achromatic telescopes (ACTs, described in Section 5) with a 2× magnification ending with an off-axis parabola (OAP), and the orange dashed boxes between NOPA2 and NOPA3 show achromatic-lens telescopes (three-lens systems) for the propagating broadband signal; meanwhile, the vacuum spatial filters (VSFs) in the light blue dashed boxes show the under-vacuum telescopes (two-lens systems) for the Magma25 RGA. Note: 4-pass MC, 4-pass Martinez compressor; D, Dazzler, spectral shaping and stretching stage; SHG, second-harmonic generation stages.
    Fig. 5. Sketch of the picosecond mJ-level front end experimental setup. The commercial Ti:sapphire oscillator (Venteon) and the two commercial RGAs (S-pulse and Magma25) are seeding and pumping the four NOPA stages, respectively. The compact seed stretcher is made by two BK7 glass blocks, as shown below the Venteon box. The violet dashed boxes are hybrid achromatic telescopes (ACTs, described in Section 5) with a 2× magnification ending with an off-axis parabola (OAP), and the orange dashed boxes between NOPA2 and NOPA3 show achromatic-lens telescopes (three-lens systems) for the propagating broadband signal; meanwhile, the vacuum spatial filters (VSFs) in the light blue dashed boxes show the under-vacuum telescopes (two-lens systems) for the Magma25 RGA. Note: 4-pass MC, 4-pass Martinez compressor; D, Dazzler, spectral shaping and stretching stage; SHG, second-harmonic generation stages.
    Spatial profile of (top) the S-pulse output on the SHG crystal and (bottom) the SHG pump.
    Fig. 6. Spatial profile of (top) the S-pulse output on the SHG crystal and (bottom) the SHG pump.
    (Top) BBO efficiency (η) and stability considering initial intensity variation in the ±5% range. (Bottom) SHG spectrum (S2ω) with BBO as a nonlinear crystal.
    Fig. 7. (Top) BBO efficiency (η) and stability considering initial intensity variation in the ±5% range. (Bottom) SHG spectrum (S2ω) with BBO as a nonlinear crystal.
    Spatial profile of (top) the Magma25 output on the SHG crystal and (bottom) the SHG pump.
    Fig. 8. Spatial profile of (top) the Magma25 output on the SHG crystal and (bottom) the SHG pump.
    Spectra related to the signal and the NOPA2 stage.
    Fig. 9. Spectra related to the signal and the NOPA2 stage.
    Near-field spatial profile of the output of (top) the first and (bottom) the second amplification stages.
    Fig. 10. Near-field spatial profile of the output of (top) the first and (bottom) the second amplification stages.
    Stability measurements performed on the NOPA2 pulses power reveal that the system is autonomously stable for about 22 min with RMS values of 3.7%. The NOPA1 PD signal value is increased by a factor of 0.3V to be better represented in the figure.
    Fig. 11. Stability measurements performed on the NOPA2 pulses power reveal that the system is autonomously stable for about 22 min with RMS values of 3.7%. The NOPA1 PD signal value is increased by a factor of 0.3V to be better represented in the figure.
    Spectra related to the NOPA4 stage.
    Fig. 12. Spectra related to the NOPA4 stage.
    Near-field spatial profile of the output of (top) the third and (bottom) the fourth amplification stages.
    Fig. 13. Near-field spatial profile of the output of (top) the third and (bottom) the fourth amplification stages.
    Stability measurements performed on the NOPA4 pulses power reveal that the system is autonomously stable for about 1 h with an RMS value of around 4%. After 1 h, a drift is noticeable and the RMS value is degraded to 10%.
    Fig. 14. Stability measurements performed on the NOPA4 pulses power reveal that the system is autonomously stable for about 1 h with an RMS value of around 4%. After 1 h, a drift is noticeable and the RMS value is degraded to 10%.
    Single-grating compressor stage sketch. Note: CM, corner mirror; M, mirror; GR, grating (line density = 1000 lines/mm, θinc= 41°, θout = 0°); L, achromatic lens (f = 15 cm), dGR–L ~15 cm and dGR–M2 ~35 cm.
    Fig. 15. Single-grating compressor stage sketch. Note: CM, corner mirror; M, mirror; GR, grating (line density = 1000 lines/mm, θinc= 41°, θout = 0°); L, achromatic lens (f = 15 cm), dGR–L ~15 cm and dGR–M2 ~35 cm.
    Profiles of compressed pulses measured with SPIDER diagnostics: (a) compressed NOPA4 temporal profile; (b), (c) stability measurement performed on the temporal length of the compressed NOPA4 output reveals that the system is autonomously stable for almost 60 min.
    Fig. 16. Profiles of compressed pulses measured with SPIDER diagnostics: (a) compressed NOPA4 temporal profile; (b), (c) stability measurement performed on the temporal length of the compressed NOPA4 output reveals that the system is autonomously stable for almost 60 min.
    Sketch of the nanosecond J-level front end experimental setup. The commercial Nd:YAG laser is pumping the three NOPA stages. The violet dashed boxes are hybrid ACTs (described in Section 5) with an OAP and the orange dashed boxes show under-vacuum achromatic-lens telescopes (three-lens systems) for the propagating broadband signal; the VSF light blue dashed boxes show the under-vacuum telescopes (two-lens systems).
    Fig. 17. Sketch of the nanosecond J-level front end experimental setup. The commercial Nd:YAG laser is pumping the three NOPA stages. The violet dashed boxes are hybrid ACTs (described in Section 5) with an OAP and the orange dashed boxes show under-vacuum achromatic-lens telescopes (three-lens systems) for the propagating broadband signal; the VSF light blue dashed boxes show the under-vacuum telescopes (two-lens systems).
    Design of a Nd:glass chain for the first high-energy pump. A 100 mW CW laser is sliced with a fiber EOM and successively amplified in a fiber to reach the nJ level. This is then amplified in an RGA to 1 mJ and injected into the chain. Note: F1, F2, Faraday; 9AMP, 16AMP, 25AMP, 45AMP, amplifiers with respective diameters in mm; SF, spatial filter; L, lens; PH, pinhole; VSF1, VSF2, vacuum spatial filters; RWP, rotating wave-plate to control output energy; λ/2, half-wave plate.
    Fig. 18. Design of a Nd:glass chain for the first high-energy pump. A 100 mW CW laser is sliced with a fiber EOM and successively amplified in a fiber to reach the nJ level. This is then amplified in an RGA to 1 mJ and injected into the chain. Note: F1, F2, Faraday; 9AMP, 16AMP, 25AMP, 45AMP, amplifiers with respective diameters in mm; SF, spatial filter; L, lens; PH, pinhole; VSF1, VSF2, vacuum spatial filters; RWP, rotating wave-plate to control output energy; λ/2, half-wave plate.
    Sketch of the upgraded air-cooled disk amplifier.
    Fig. 19. Sketch of the upgraded air-cooled disk amplifier.
    Telescope between the ns OPCPA and the first high-energy OPCPA stage: (a) sketch in the OpticStudio environment; (b) residual optical path.
    Fig. 20. Telescope between the ns OPCPA and the first high-energy OPCPA stage: (a) sketch in the OpticStudio environment; (b) residual optical path.
    Architecture of the high-energy nanosecond compressor.
    Fig. 21. Architecture of the high-energy nanosecond compressor.
    BBO LBO KD*P
    deff (pm/V)20.830.25
    Walk-off (°)3.20.421.4
    Noncollinear angle (°)2.291.560.23[20]; 0.95[21]
    Amplification bandwidth (nm)300[22]250[23]200[20,21]
    Crystal length (mm)1020–5022[20]
    Central wavelength (nm)800870980
    Damage threshold @1.3 ns (GW/cm2)0.3198.4
    Maximum crystal size (mm)20170[24]; 200[25]>400
    Type of phase matchingIII
    Table 1. Comparison of the three evaluated nonlinear crystals to be implemented in the Vulcan OPPEL system at different central wavelengths.
    ps front endns front endVulcan OPPEL
    λp (nm)515532526.5
    Lc (mm)20; 19; 151923
    θNC ()2.562.162.27
    Ep (mJ)0.3; 4; 832; 125; 3.1 × 10320 × 103;130 × 103
    Table 2. Summary of the simulation parameters regarding the NOPA block stages.
    NOPA1NOPA2
    Lc (mm)2019
    θNC (°)2.562.56
    Ep (ҼJ)300300
    Output (ҼJ)~0.130
    Efficiency (%)0.0310
    Table 3. Summary of the ҼJ-level NOPA stages.
    NOPA3NOPA4
    Lc (mm)1520
    θNC (°)2.562.56
    Ep (mJ)48
    Output (mJ)0.31.5
    Efficiency (%)7.519
    Table 4. Summary of the mJ-level NOPA stages.
    ns NOPA1ns NOPA2ns NOPA3
    Lc (mm)191919
    θNC (°)2.162.162.16
    Ep (mJ)321253100
    Output (mJ)1.3591500
    Efficiency (%)3.94748
    Table 5. Summary of the J-level nanosecond NOPA stages.
    Multi-J NOPA1Multi-J NOPA2
    Lc (mm)2319
    θNC (°)2.272.27
    Ep (J)20130
    Output (J)750
    Efficiency (%)5040
    Table 6. Summary of the mJ-level NOPA stages.
    Mario Galletti, Pedro Oliveira, Marco Galimberti, Munadi Ahmad, Giedre Archipovaite, Nicola Booth, Emerald Dilworth, Andy Frackiewicz, Trevor Winstone, Ian Musgrave, Cristina Hernandez-Gomez. Ultra-broadband all-OPCPA petawatt facility fully based on LBO[J]. High Power Laser Science and Engineering, 2020, 8(4): 04000e31
    Download Citation