
David González-Andrade, José Manuel Luque-González, J. Gonzalo Wangüemert-Pérez, Alejandro Ortega-Moñux, Pavel Cheben, Íñigo Molina-Fernández, Aitor V. Velasco. Ultra-broadband nanophotonic phase shifter based on subwavelength metamaterial waveguides[J]. Photonics Research, 2020, 8(3): 359
- Photonics Research
- Vol. 8, Issue 3, 359 (2020)
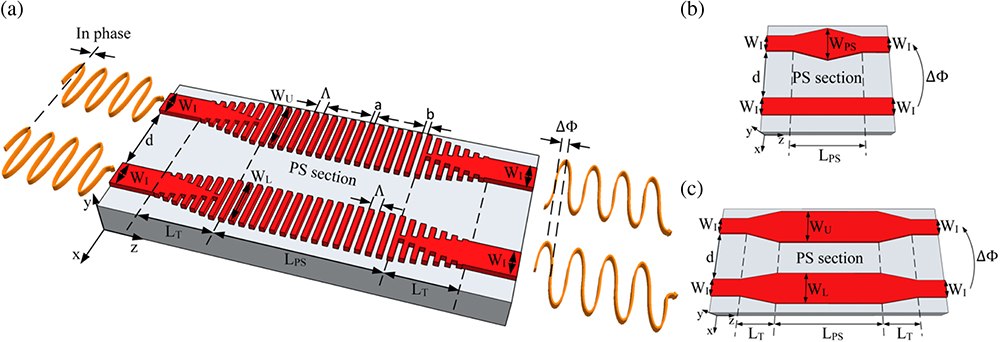
Fig. 1. Schematics of three types of passive phase shifters: (a) our proposed ultra-broadband PS comprising two SWG waveguides with the same period (Λ W U W L W U W L
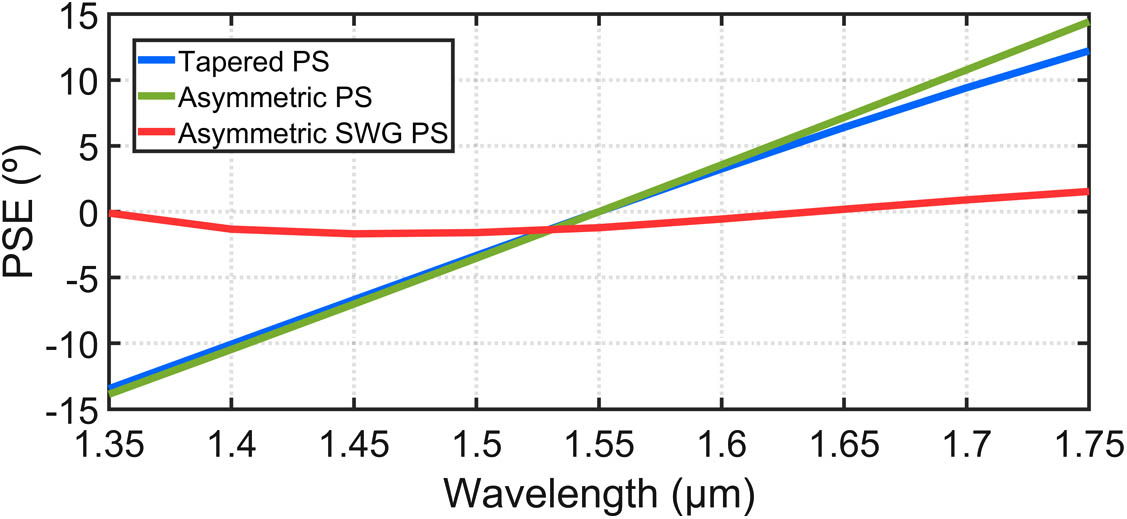
Fig. 2. Comparison of the PSE as a function of wavelength for the three designed PSs: tapered PS (blue curve), asymmetric PS (green curve), and asymmetric SWG PS (red curve).
Fig. 3. (a) PSE as a function of wavelength for two parallel SWG waveguides with DC = 50 % W L = 1.6 μm W U = 1.8 μm Λ = 200 nm Λ = 200 nm
Fig. 4. Simulated maximum PSE in the wavelength range 1.35–1.75 μm. For each wavelength, the highest error between PSE ( Δ δ = + 20 nm ) PSE ( Δ δ = − 20 nm )
Fig. 5. Schematic of the test structures used to experimentally characterize (a) the tapered PS and (b) the asymmetric SWG PS. Each structure is composed of two ultra-broadband SWG MMIs and 14 PSs connected in series, forming an MZI. SEM images of the fabricated (c) tapered PS and (d) asymmetric SWG PS as indicated by the blue box in the schematic.
Fig. 6. Measured spectra of the MZIs (a) with 14 tapered PSs and (b) with 14 SWG PSs. The light was injected through port 1, and both outputs of the test structure (ports 3 and 4) were measured. (c) Measured PSE for a single tapered PS (solid blue line) and a single asymmetric SWG PS (solid red line). Dotted lines correspond to the simulation results obtained via 3D-FDTD.
Fig. 7. Fitting of the circuit model to the measured spectra of the MZIs with (a) 14 tapered PSs and (b) 14 SWG PSs.
|
Table 1. Comparison Between Active and Passive Phase Shiftersa

Set citation alerts for the article
Please enter your email address
© Copyright 2018-2021 | Chinese Laser Press. All Rights Reserved 沪ICP备15018463号-20