• Acta Photonica Sinica
  • Vol. 50, Issue 2, 192 (2021)
Gang CHENG1, Yanan CAO1, Xing TIAN1, Kun LIU2, and Jiajin CHENG2
Author Affiliations
  • 1State Key Laboratory of Mining Response and Disaster Prevention and Control in Deep Coal Mines, Anhui University of Science and Technology, Huainan, Anhui23200, China
  • 2Anhui Institute of Optics and Fine Mechanics, Chinese Academy of Sciences, Hefei30031, China
  • show less
    DOI: 10.3788/gzxb20215002.0230001 Cite this Article
    Gang CHENG, Yanan CAO, Xing TIAN, Kun LIU, Jiajin CHENG. Calculation and Evaluation of Acoustic and Flow Field Characteristics of Trapezoid Compound Photoacoustic Cell[J]. Acta Photonica Sinica, 2021, 50(2): 192 Copy Citation Text show less
    Cylindrical acoustic resonant photoacoustic cell model
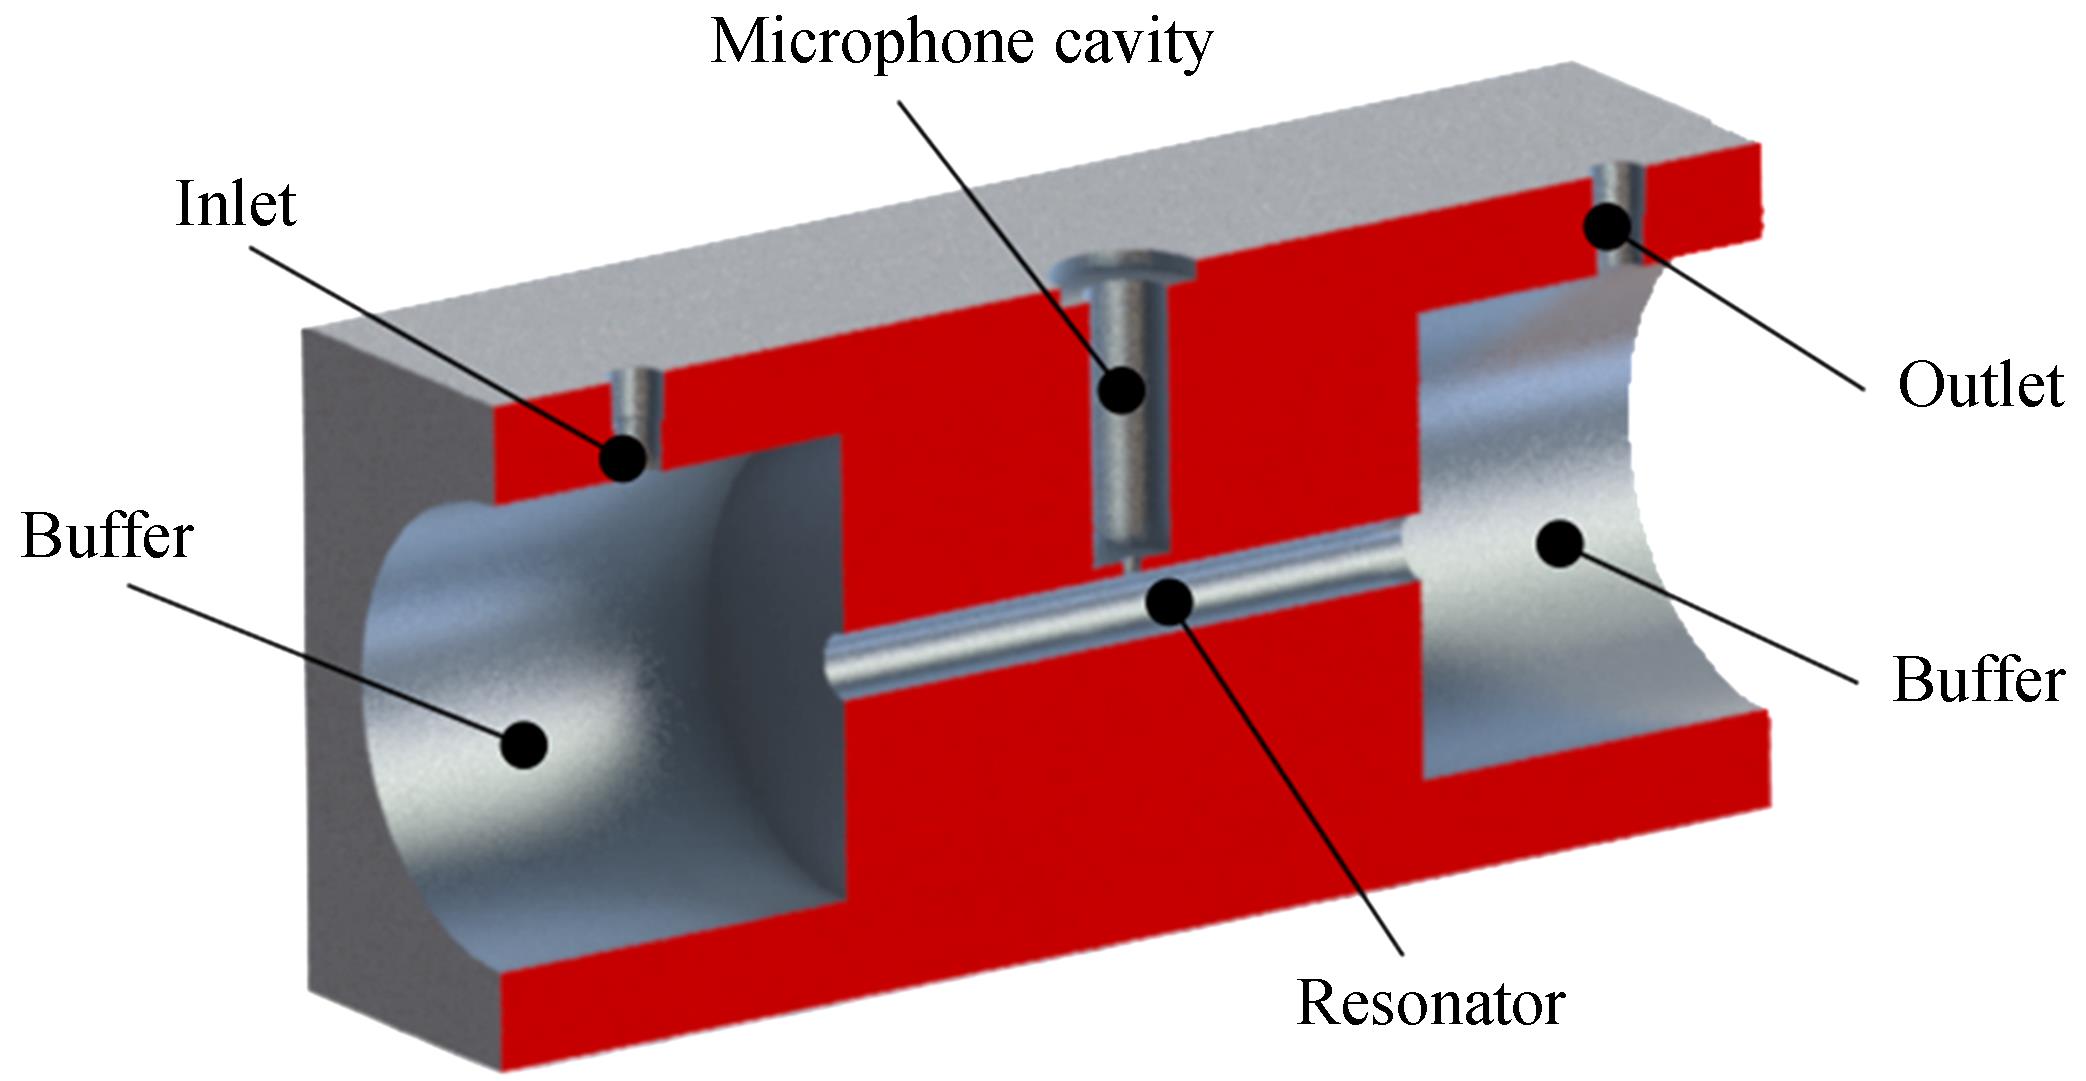
    Fig. 1. Cylindrical acoustic resonant photoacoustic cell model
    Grid model of photoacoustic cell and simulation results of sound pressure
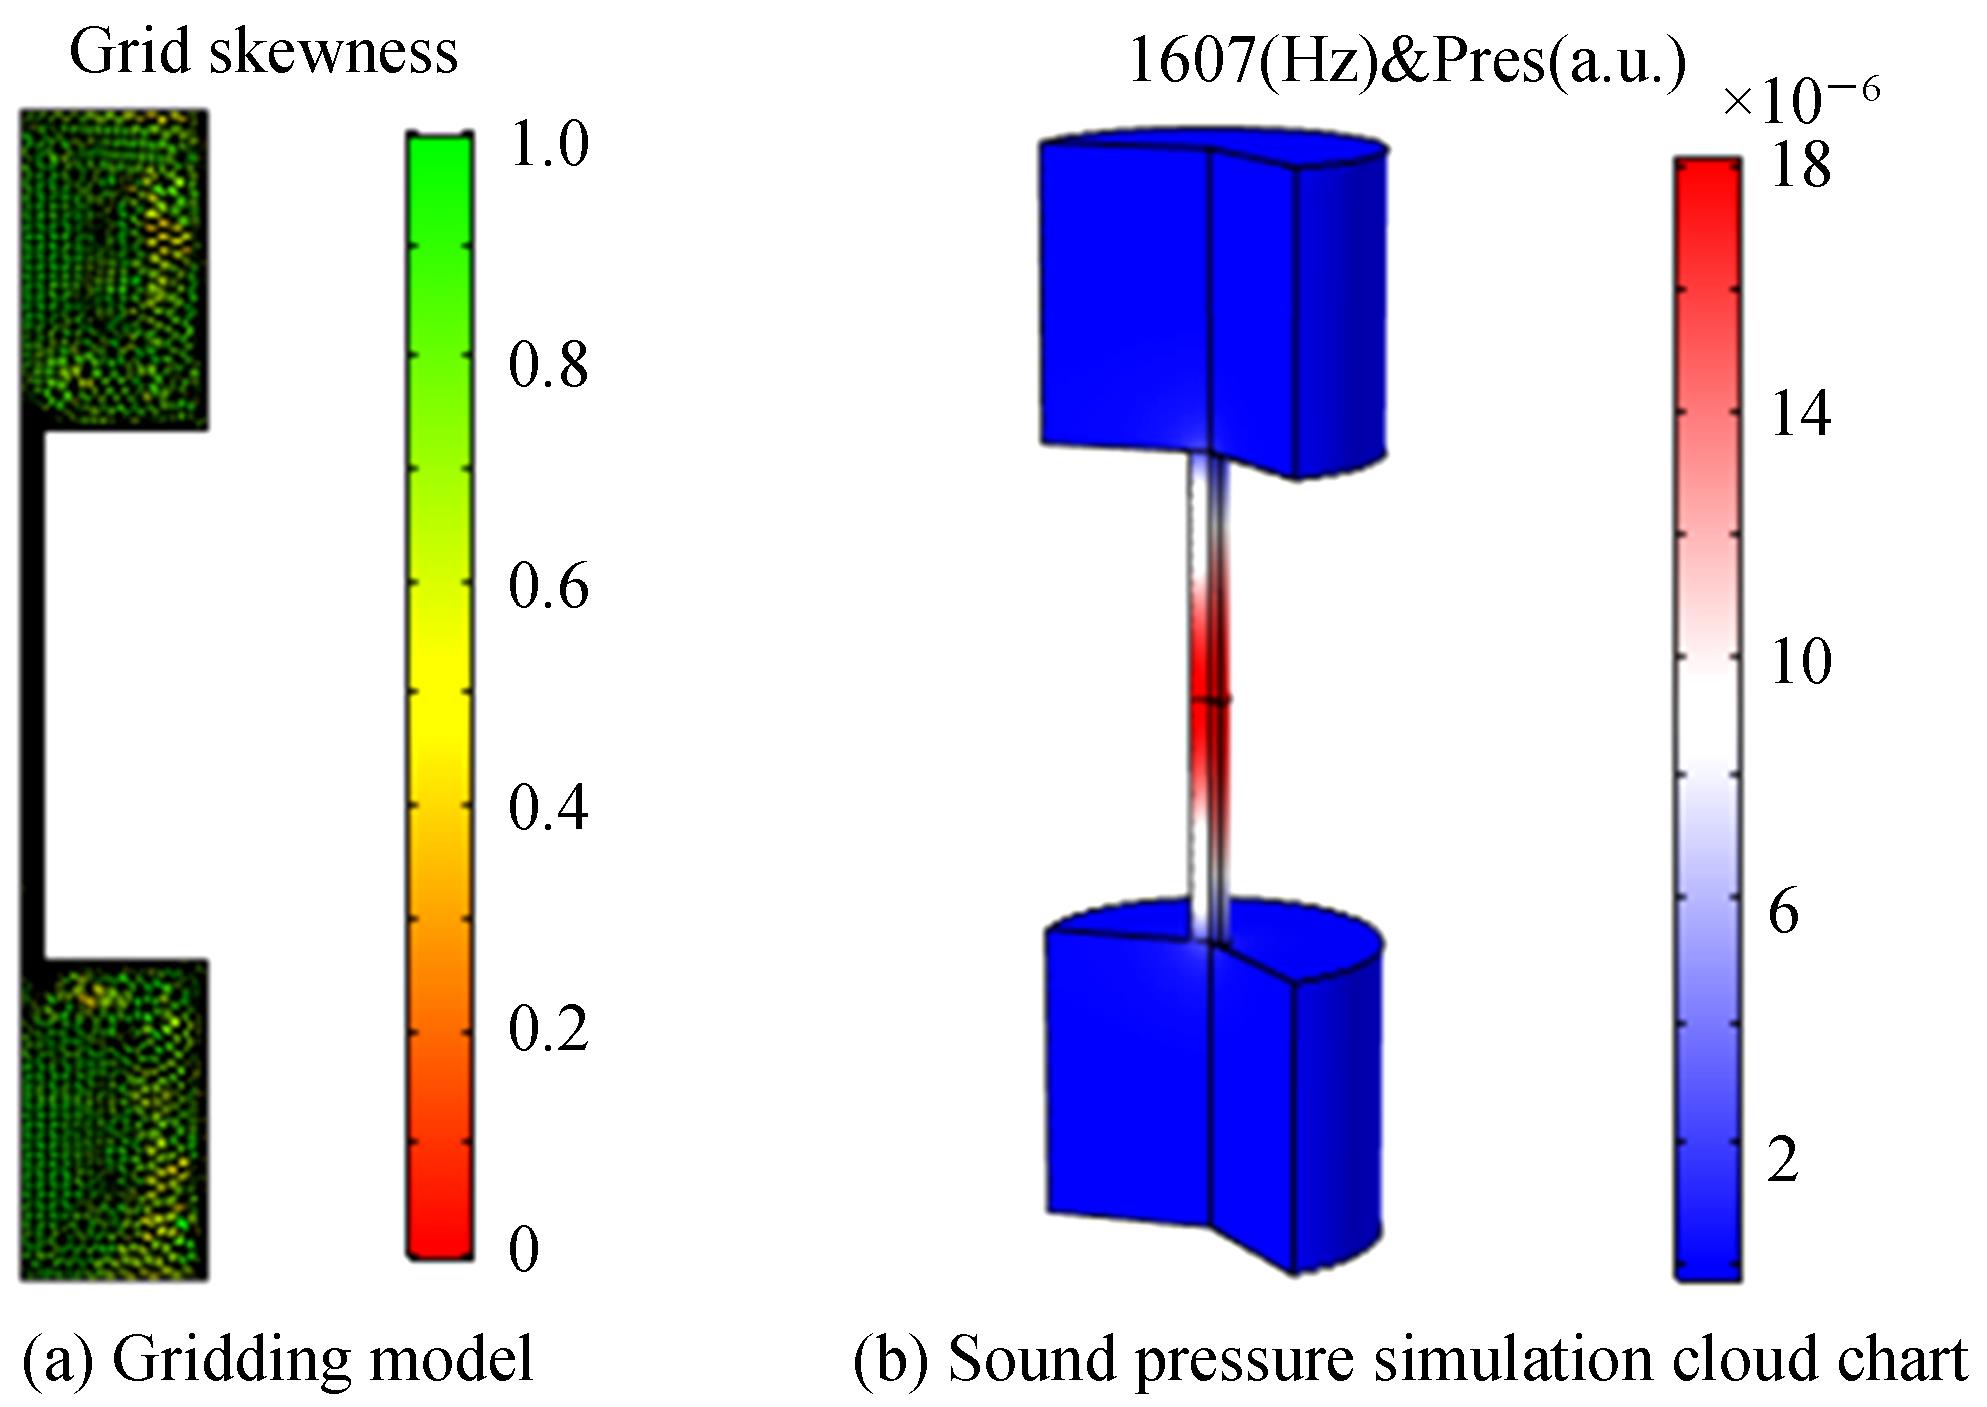
    Fig. 2. Grid model of photoacoustic cell and simulation results of sound pressure
    Comparison of analytical and simulation results
    Fig. 3. Comparison of analytical and simulation results
    Structure of the trapezoid compound photoacoustic cell
    Fig. 4. Structure of the trapezoid compound photoacoustic cell
    Effect of trapezoidal cavity radius on the performance of the photoacoustic cell
    Fig. 5. Effect of trapezoidal cavity radius on the performance of the photoacoustic cell
    Effect of trapezoidal cavity length on performance of the photoacoustic cell
    Fig. 6. Effect of trapezoidal cavity length on performance of the photoacoustic cell
    Structural models with different number of steps
    Fig. 7. Structural models with different number of steps
    Flow field distribution in front and back symmetrical section of the photoacoustic cell
    Fig. 8. Flow field distribution in front and back symmetrical section of the photoacoustic cell
    Flow field section distribution of the photoacoustic cell (R = 3 mm)
    Fig. 9. Flow field section distribution of the photoacoustic cell (R = 3 mm)
    Gas velocity distribution along the axis of three photoacoustic cells
    Fig. 10. Gas velocity distribution along the axis of three photoacoustic cells
    Frequency scanning results of three photoacoustic cells
    Fig. 11. Frequency scanning results of three photoacoustic cells
    NPressure/PaFrequence/HzSound pressure distribution
    12.49×10-51 457
    22.37×10-51 519
    32.33×10-51 540
    Table 1. Simulation results with different N
    Gang CHENG, Yanan CAO, Xing TIAN, Kun LIU, Jiajin CHENG. Calculation and Evaluation of Acoustic and Flow Field Characteristics of Trapezoid Compound Photoacoustic Cell[J]. Acta Photonica Sinica, 2021, 50(2): 192
    Download Citation