• Chinese Optics Letters
  • Vol. 18, Issue 7, 070601 (2020)
Mi Li*, Yuan Chen, Yuejiang Song, Cheng Zeng, and Xuping Zhang
Author Affiliations
  • Key Laboratory of Intelligent Optical Sensing and Manipulation, College of Engineering and Applied Sciences, Nanjing University, Nanjing 210093, China
  • show less
    DOI: 10.3788/COL202018.070601 Cite this Article Set citation alerts
    Mi Li, Yuan Chen, Yuejiang Song, Cheng Zeng, Xuping Zhang. DOE effect on BER performance in MSK space uplink chaotic optical communication[J]. Chinese Optics Letters, 2020, 18(7): 070601 Copy Citation Text show less
    (a) Schematic diagram of a space uplink chaotic communication system. (b) The optical subsystem before and after introducing the DOEs.
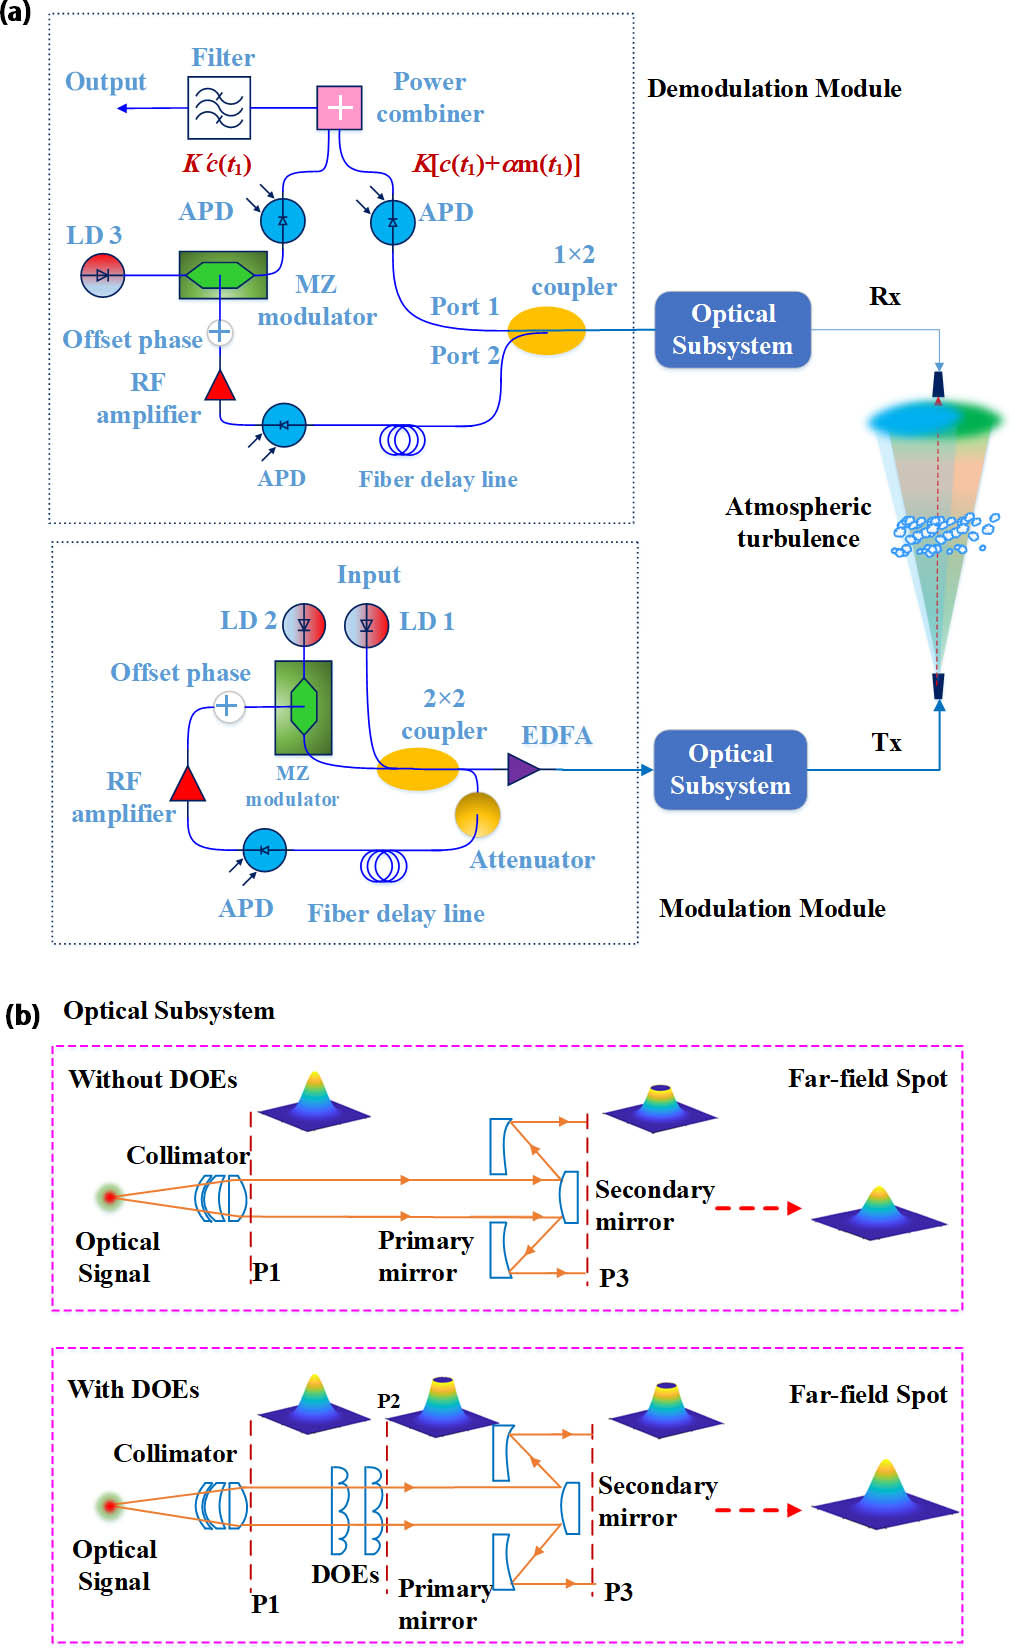
    Fig. 1. (a) Schematic diagram of a space uplink chaotic communication system. (b) The optical subsystem before and after introducing the DOEs.
    (a) Input spot. (b) The spot at the exiting pupil in a system without the DOEs. (c) The spot at the exiting pupil in a system with the DOEs. (d) The intensity of the beam at Rx.
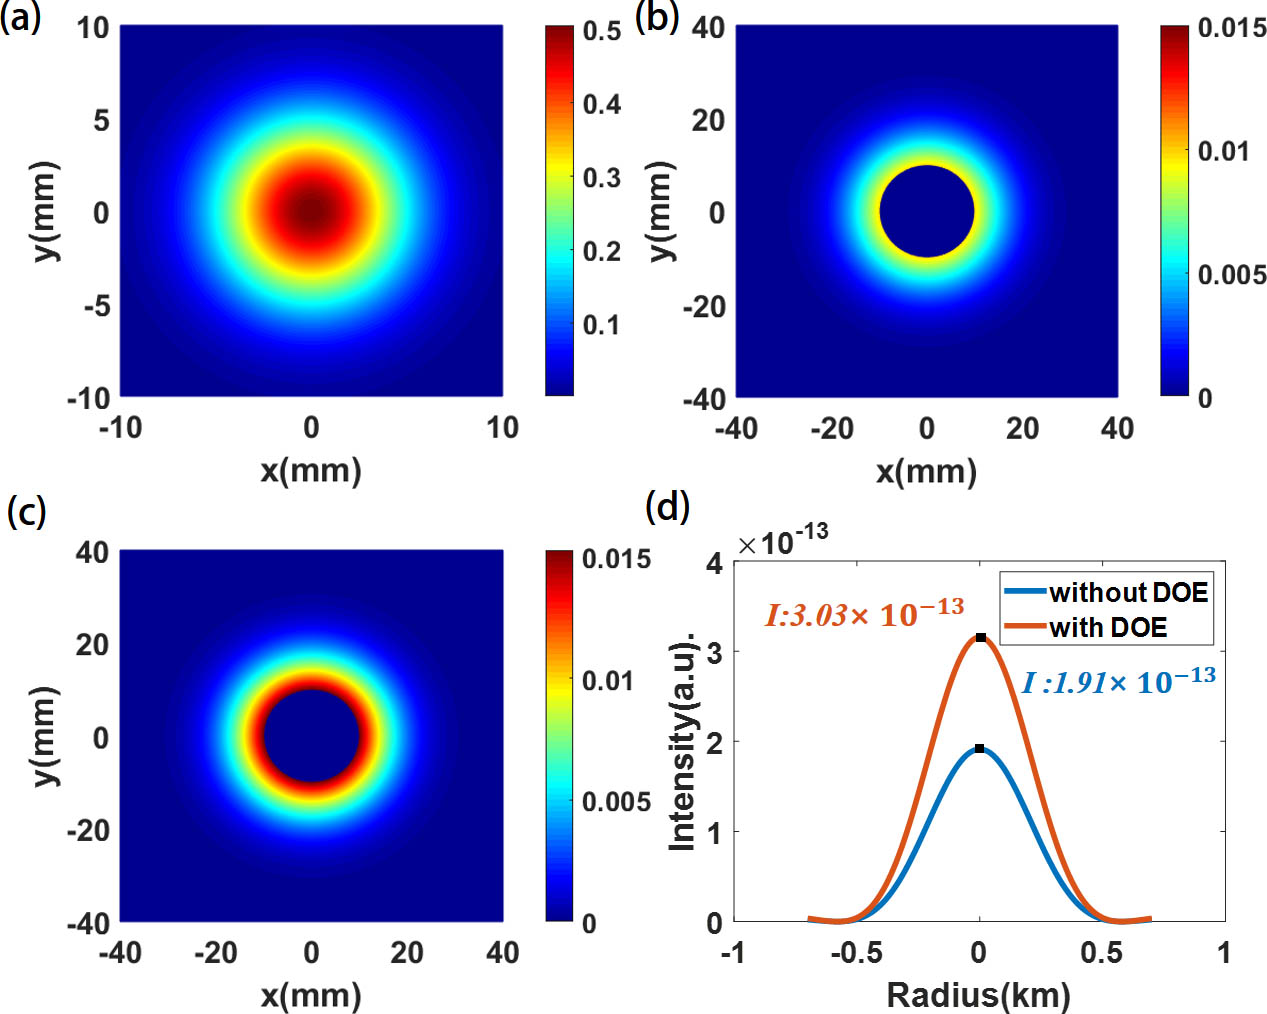
    Fig. 2. (a) Input spot. (b) The spot at the exiting pupil in a system without the DOEs. (c) The spot at the exiting pupil in a system with the DOEs. (d) The intensity of the beam at Rx.
    Weak atmospheric turbulence. (a) The BER relationship versus transmission power at different chaotic mismatch levels. (b) The total noise relationship versus transmission power at different chaotic mismatch levels. (c) The PDF distribution at Pt=2 W, 6 W, and 10 W. The I¯ in red is the average receiving power in the system without the DOEs and the I¯ in blue is the average receiving power in the system with the DOEs.
    Fig. 3. Weak atmospheric turbulence. (a) The BER relationship versus transmission power at different chaotic mismatch levels. (b) The total noise relationship versus transmission power at different chaotic mismatch levels. (c) The PDF distribution at Pt=2W, 6 W, and 10 W. The I¯ in red is the average receiving power in the system without the DOEs and the I¯ in blue is the average receiving power in the system with the DOEs.
    Strong atmospheric turbulence. (a) The BER relationship versus transmission power at different chaotic mismatch levels. (b) The total noise relationship versus transmission power at different chaotic mismatch levels in a system without the DOEs. (c) The PDF distribution at Pt=2 W, 6 W, and 10 W. The I¯ in red is the average receiving power in the system without the DOEs and the I¯ in blue is the average receiving power in the system with the DOEs.
    Fig. 4. Strong atmospheric turbulence. (a) The BER relationship versus transmission power at different chaotic mismatch levels. (b) The total noise relationship versus transmission power at different chaotic mismatch levels in a system without the DOEs. (c) The PDF distribution at Pt=2W, 6 W, and 10 W. The I¯ in red is the average receiving power in the system without the DOEs and the I¯ in blue is the average receiving power in the system with the DOEs.
    BER relationship versus the receiving diameter at different atmospheric turbulence conditions.
    Fig. 5. BER relationship versus the receiving diameter at different atmospheric turbulence conditions.
    BER relationship versus the transmitting aperture at different atmospheric turbulence conditions.
    Fig. 6. BER relationship versus the transmitting aperture at different atmospheric turbulence conditions.
    BER relationship versus the zenith angle at different atmospheric turbulence conditions.
    Fig. 7. BER relationship versus the zenith angle at different atmospheric turbulence conditions.
    BER relationship versus the bit rate at different atmospheric turbulence conditions.
    Fig. 8. BER relationship versus the bit rate at different atmospheric turbulence conditions.
    Mi Li, Yuan Chen, Yuejiang Song, Cheng Zeng, Xuping Zhang. DOE effect on BER performance in MSK space uplink chaotic optical communication[J]. Chinese Optics Letters, 2020, 18(7): 070601
    Download Citation