
Fengdong Chen, Jingyang Sun, Qian Wang, Hongbo Zhu, Fa Zeng, Yueyue Han, Cheng Lu, Guodong Liu, "In-situ laser-induced surface damage inspection based on image super-resolution and adaptive segmentation method," Chin. Opt. Lett. 20, 071101 (2022)
- Chinese Optics Letters
- Vol. 20, Issue 7, 071101 (2022)
Abstract
1. Introduction
A promising and controllable way of inertial confinement fusion (ICF) is to focus high-power lasers to compress and heat a fuel capsule (target) positioned at the center of a vacuum target chamber to achieve fusion ignition. In-situ inspection of laser-induced damage (LID) on optics plays an important role for these high-power laser systems[
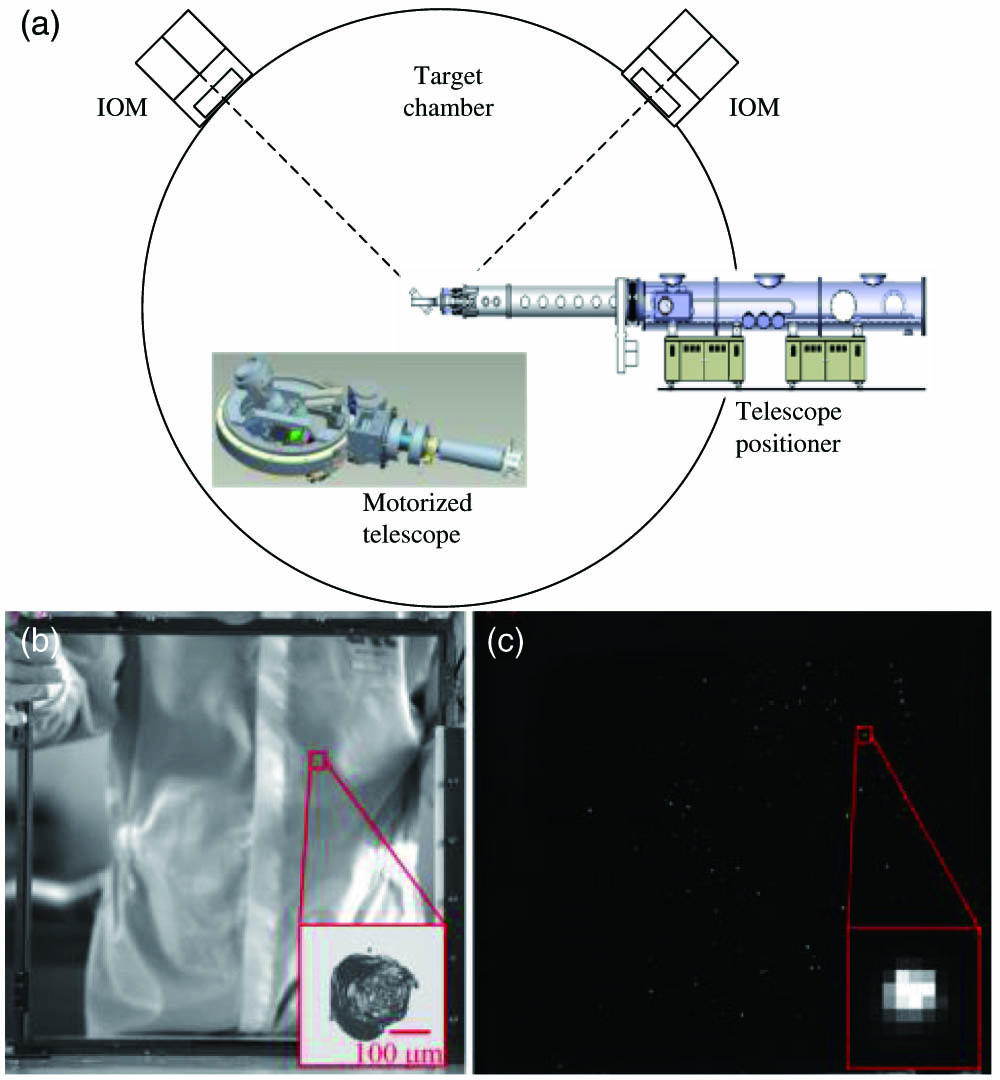
We had developed an in-situ final optics damage inspection (FODI) system[
![]()
Figure 1.(a) Sketch-map of the FODI. (b) An optic in IOM and an example of LID inside (196 µm). (c) The FODI image of the optics and the LID corresponding to (b).
The distance between the IOM and the FODI camera is in the range of 3.7–5.1 m. The size of large aperture optics is
Sign up for Chinese Optics Letters TOC. Get the latest issue of Chinese Optics Letters delivered right to you!Sign up now
The online image is required to be able to detect LIDs larger than 150 µm and ensure that the mean relative error (MRE) is less than 15%. Therefore, directly detecting an LID on the surface of the optic with a diameter of less than 100 µm is difficult.
A proper illumination of the optics to be imaged is critical for the detection of small LIDs. Edge illumination is employed here for each optic, which relies on light injected at the proper angle into the edge of the optics that subsequently becomes trapped through total internal reflection (TIR) (Fig. 2). An LID on the optic surface disrupts the TIR and causes light to scatter from the optic at the flaw location. A percentage of this scattered light is collected and imaged by the FODI imaging system, which appears bright against a dark background (named darkfield imaging). Edge illumination lights only the optic to be imaged and provides excellent local signal to noise ratio performance. The 150 µm flaw is readily apparent in the darkfield image.
![]()
Figure 2.Sketch-map of the online optics damage inspection by using TIR illumination and remote imaging method. Edge illumination lights are the only optic to be imaged.
An edge illumination system was developed specifically for FODI. Two semiconductor laser light source modules were developed and inlayed into the mounts of optics within the IOM (Fig. 3).
![]()
Figure 3.Semiconductor laser light source (wavelength is 808 nm).
The size of initiated LID may be less than 50 µm. The edge illumination is uneven, the damage signal in the dark part may be weak, and the imaging resolution is lower than the LID size. For these tiny LIDs, whether they had grown up is the focus of online detection, but these flaws are too small and difficult to detect or accurately segment (Fig. 4).
![]()
Figure 4.Edge illumination is uneven. An initiated LID is difficult to detect or accurately segment to judge whether they have grown up. (a) Online image. (b) Uneven lighting simulation.
Aiming at these problems, we propose a method (Fig. 5), which effectively improves the initial LID detection ability through super-resolution reconstruction (SR) and adaptive segmentation method.
![]()
Figure 5.Sketch-map of the SR and adaptive segmentation method.
2. Theoretical Analysis
2.1. Image super-resolution by multi-attention fusion
The FODI images are darkfield images with less texture information. Most of the areas in the image are smooth and black, and there are fewer features that can be used to learn for image SR. Therefore, attention mechanisms need to be introduced that can focus the operation of the deep neural network on more important information areas. The choice of a single attention mechanism method can only pay attention to one image level and cannot adapt to the SR requirements, so we propose an image SR improvement method by integrating layers, channel space, planar areas, edges, and corner points[
The essence of image SR is to learn the regression mapping function from low-resolution (LR) images to high-resolution (HR) images from the features of the LR-HR image pairs, which can achieve an image resolution that exceeds the optical resolution determined by the Rayleigh criterion.
The SR methods have made great strides because of deep learning techniques. The first algorithm to apply convolutional neural networks (CNNs) to image SR in 2014 was SRCNN[
In 2020, progress was made in channel attention, with typical approaches including component divide-and-conquer (CDC)[
In 2021, Chen et al. proposed a local hidden function method called local implicit image function (LIIF)[
Based on the above analysis, CDC and HAN integrated methods are used in this paper, which make full use of the information of the boundary area of the damage point in the darkfield image for image SR.
We conduct transfer learning and integrate the SR images obtained by CDC (CDC_SR) and HAN (HAN_SR) by adaptive weight and using structural similarity (SSIM) for evaluation to improve the quality of the integrated SR image. The integration method is as follows:
The final HR image Y can be obtained by minimizing Eq. (2) via the limited-memory Broyden–Fletcher–Goldfarb–Shanno (L-BFGS) algorithm[
SSIM is defined as
2.2. Adaptive image segmentation method
The uneven illumination and the variety of damage types (Fig. 6) make the accurate segmentation of LID a challenging job.
![]()
Figure 6.Examples showing only backlit illumination of the 12 classes in the “Damage Morphology” dataset[
The local area signal-to-noise ratio (LASNR) method[
Other learnable methods can be found in the challenging document image binarization studies. According to how the thresholding values are computed for image binarization, these methods can be divided into histogram-based methods[
In order to avoid relying heavily on the training dataset, we designed an adaptive image segmentation algorithm based on the image SR.
For segmentation of the integrated SR image, for a pixel at position
The parameter mask_size specifies the size of the neighborhood in which the local threshold is calculated. The smaller the window size, the thinner the segmented flaw. Mask_size must be set to a value that is larger than the LID size in the original image. Mask_size needs to be multiplied by the super-resolution factor
The parameter k controls how much the threshold value differs from the local mean value. Using a smaller value of k can segment structures with lower contrast to their background. Using larger k values can suppress clutter. Changing k can determine the area of the LID.
The k value varies from large to small (k1 > k2 > k3), and the segmented area of the local seed area also increases. When an LID is super-imposed on a background feature or noise with elevated intensity, reducing the k can include all connected pixels greater than the proper pixels and falsely label the background feature as part of the LID, as shown in Fig. 7.
![]()
Figure 7.Cross section of the isolated peak and cross section of the peak super-imposed on a background feature, both shown with cross hatching to indicate the total area included when a fixed k is used to define the extent of an LID. For a peak that is not over a background feature, the area of the LID increases smoothly as the k is decreased. However, for a peak that overlays a background feature, the area will sharply increase when the k drops below the level of the background feature.
When the rate of change of k reaches the maximum value, the k is then used as the threshold for the local segmentation.
3. Experimental Results and Discussion
3.1. Experiment
Figure 8 is the diagram of the FODI online experiment configuration, and Fig. 9 is the actual optical system of IOM and the optical imaging lens.
![]()
Figure 8.Diagram of the FODI online experiment device.
![]()
Figure 9.Optical system of the IOM and the optical imaging lens.
The IOM contains nine large aperture optics, as shown in Fig. 9, from left to right: vacuum closed window, fundamental frequency cepstral peak performance (CPP), double frequency crystal, mixing crystal 1, mixing crystal 2, wedge lens (convex optic), big-aperture sampling grating (BSG), triple frequency CPP, and vacuum isolation sheet.
Since the IOM contains a wedge-shaped lens, the optimized optical design of the optical imaging lens is associated with IOM’s optics. The main objective group is fixed, and the distance from the IOM remains constant. The focus objective group is a zoom lens group, which changes the focal length by changing the distance between the focus objective group and the main objective. By moving the position of the CCD, the image is maintained clearly, and the magnification of the imaging system is basically constant.
The optical resolution (derived from the modulation transfer function) and pixel resolution (pixel equivalent) are shown in Table 1.
| Distance (m) | Optical Element | Optical Resolution (μm) | Pixel Resolution (μm/pixel) |
|---|---|---|---|
| 5.1 | Shielding sheet | 136.17 | 137.04 |
| 3.7 | Vacuum window | 124.63 | 125.42 |
Table 1. Optical Resolution and Pixel Resolution of the Optical Lens at Different Locations
We captured 200 online images and made a dataset. We carried out transfer learning for HAN and CDC SR methods using the dataset by down sampling the online images.
We randomly selected 12 images from the 100 test images to verify the effectiveness of the present method.
3.2. Discussion
The HAN, CDC, and integrated SR images are obtained as shown in Fig. 10.
![]()
Figure 10.SR results. (a) Online original FODI image of wedge lens. (b) An example window of original resolution. (c) The 2× resolution of the HAN_SR (SSIM = 0.92). (d) The 4× resolution of the HAN_SR (SSIM = 0.91). (e) The 2× resolution of the CDC_SR (SSIM = 0.92). (f) The 4× resolution of the CDC_SR (SSIM = 0.91). (g) The 2× resolution of the integrated result (SSIM = 0.95). (h) The 4× resolution of the integrated result (SSIM = 0.94).
In this SR experiment, the SSIM value of the integrated SR image was improved by an average of 3%, which proves that the proposed SR integrating method has a lifting effect.
Figure 11 shows an example of one LID in an integrated SR image whose size is less than 100 µm.
![]()
Figure 11.Example result of SR image of one LID. (a) Online original FODI image of wedge lens. (b) An example of original resolution of an LID inside (94.0 µm). (c) The 2× integrated resolution of the LID. (d) The 4× integrated resolution of the LID.
Adaptive LID segmentation is performed using the integrated resolution images to detect LIDs. The experimental results are shown in Fig. 12.
![]()
Figure 12.Adaptive LID segmentation results. (a) Online original image of wedge lens segmentation result. (b) The example window of the original resolution segmentation result (46 LID sites found). (c) The 2× integrated resolution image segmentation result (75 LID sites found). (d) The 4× integrated resolution image segmentation result (90 LID sites found).
In this image segmentation experiment, the number of LIDs was found to be increased 0.6 times and 0.9 times, respectively, in
The detection rate results of the randomly selected 12 images showed that our method can evenly detect 93.4%, 96.5%, and 97.7% surface LIDs with diameter more than 50 µm, respectively, in the original,
![]()
Figure 13.Quartile statistical chart of detection rate of LIDs (>50) in the 12 images of the original, 2×, and 4× integrated resolution.
In addition, the boundary locations are subdivided, which helps to improve the accuracy of boundary positioning.
4. Conclusion
An in-situ LID inspection method was presented based on laser TIR darkfield imaging, image SR integrating, and adaptive segmentation. The method can detect the LIDs with few pixels and uneven lighting conditions. The method can improve the initial damage detection capabilities, and the validity was proved by the experimental results.
References
[1] D. F. P. Pile. Redlining lasers for nuclear fusion. Nat. Photon., 15, 863(2021).
[2] A. Conder, J. Chang, L. Kegelmeyer, M. Spaeth, P. Whitman. Final optics damage inspection (FODI) for the National Ignition Facility. Proc. SPIE, 7797, 77970P(2010).
[3] M. C. Nostrand, C. W. Carr, Z. M. Liao, J. Honig, M. L. Spaeth, K. R. Manes, M. A. Johnson, J. J. Adams, D. A. Cross, R. A. Negres, C. C. Widmayer, W. H. Williams, M. J. Matthews, K. S. Jancaitis, L. M. Kegelmeyer. Tools for Predicting Optical Damage on Inertial Confinement Fusion-Class Laser Systems(2011).
[4] F. Wei, F. Chen, B. Liu, Z. Peng, J. Tang, Q. Zhu, D. Hu, Y. Xiang, N. Liu, Z. Sun, G. Liu. Automatic classification of true and false laser-induced damage in large aperture optics. Opt. Eng., 57, 053112(2018).
[5] P. Wei, Z. Xie, H. Lu, Z. Zhan, Q. Ye, W. Zuo, L. Lin. Component divide-and-conquer for real-world image super-resolution(2020).
[6] B. Niu, W. Wen, W. Ren, X. Zhang, L. Yang, S. Wang, K. Zhang, X. Cao, H. Shen. Single image super-resolution via a holistic attention network(2020).
[7] C. Dong, C. C. Loy, K. He, X. Tang. Learning a deep convolutional network for image super-resolution. European Conference on Computer Vision, 184(2014).
[8] K. He, X. Zhang, S. Ren, J. Sun. Deep residual learning for image recognition. Proceedings of the IEEE Conference on Computer Vision and Pattern Recognition, 770(2016).
[9] J. Kim, J. K. Lee, K. M. Lee. Deeply-recursive convolutional network for image super-resolution(2016).
[10] T. Tong, G. Li, X. Liu, Q. Gao. Image super-resolution using dense skip connections. IEEE International Conference on Computer Vision (ICCV), 4809(2017).
[11] Y. Zhang, K. Li, K. Li, L. Wang, B. Zhong, Y. Fu. Image super-resolution using very deep residual channel attention networks. European Conference on Computer Vision, 294(2018).
[12] Y. Chen, S. Liu, X. Wang. Learning continuous image representation with local implicit image function. IEEE/CVF Conference on Computer Vision and Pattern Recognition (CVPR), 8628(2021).
[13] X. Zhang, Q. Chen, R. Ng, V. Koltun. Zoom to learn, learn to zoom. IEEE Conference on Computer Vision and Pattern Recognition, 3762(2019).
[14] C. Zhu, R. H. Byrd, P. Lu, J. Nocedal. Algorithm 778: L-BFGS-b: Fortran subroutines for large-scale bound-constrained optimization. ACM Trans. Math. Softw., 23, 550(1997).
[15] C. Amorin, L. M. Kegelmeyer, W. P. Kegelmeyer. A hybrid deep learning architecture for classification of microscopic damage on National Ignition Facility laser optics. Stat. Anal. Data Min., 12, 505(2019).
[16] L. Kegelmeyer, P. Fong, S. Glenn, J. Liebman. Local area signal-to-noise ratio (LASNR) algorithm for image segmentation. Proc. SPIE, 6696, 66962H(2007).
[17] P. Stathis, E. Kavallieratou, N. Papamarkos. An evaluation technique for binarization algorithms. J. Univers. Comput. Sci., 14, 3011(2008).
[18] I. K. Kim, D.-W. Jung, R.-H. Park. Document image binarization based on topographic analysis using a water flow model. Pattern Recognit., 35, 265(2002).
[19] Y. Wu, P. Natarajan, S. Rawls, W. AbdAlmageed. Learning document image binarization from data. IEEE International Conference on Image Processing (ICIP), 3763(2016).


Set citation alerts for the article
Please enter your email address

© Copyright 2018-2021 | Chinese Laser Press. All Rights Reserved 沪ICP备15018463号-20