
Jun Li, Ruixu Yao, Meiying Ren, Jiarui Zhang, Xinwei Zhang, Tian Ma. Distributed Optical Fiber Vibration Signal Recognition Technology Based on Gramian Angular Field[J]. Chinese Journal of Lasers, 2024, 51(5): 0506003
- Chinese Journal of Lasers
- Vol. 51, Issue 5, 0506003 (2024)
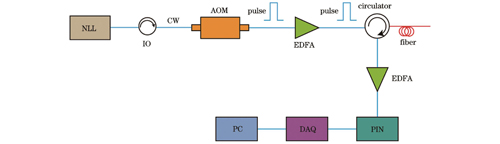
Fig. 1. Schematic diagram of distributed optical fiber vibration monitoring system based on phase-sensitive optical time-domain reflection (φ-OTDR)
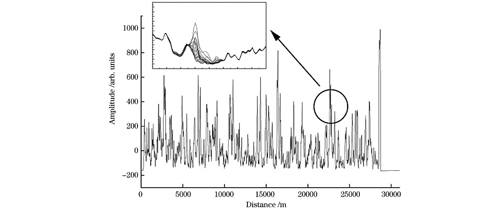
Fig. 2. Disturbance trace diagram of distributed optical fiber vibration monitoring system based on φ-OTDR
Fig. 3. Diagram of GAF image encoding process for manual excavation vibration signal
Fig. 4. GAF simulation of sinusoidal signal with different frequencies
Fig. 5. Flow chart of the algorithm
Fig. 6. Time-domain signal waveforms and corresponding GAF images of the six types of events. (a)‒(b) Manual excavation event; (c)‒(d) walking event; (e)‒(f) machine damage event; (g)‒(h) noise event; (i)‒(j) water flow vibration event; (k)‒(l) vehicle vibration event
Fig. 7. Accuracy curves and Loss function of GoogLeNet, VGG, and AlexNet models in training and test datastes. (a) Training accuracy of the models; (b) training Loss function of the models; (c) test accuracy of the models; (d) test Loss function of the models
Fig. 8. VGG ROC curve
Fig. 9. VGG confusion matrix
Fig. 10. AlexNet ROC curve
Fig. 11. AlexNet confusion matrix
Fig. 12. GoogLeNet ROC curve
Fig. 13. GoogLeNet confusion matrix
Fig. 14. Confusion matrices under different signal-noise ratio values. (a) Signal-noise ratio is 2 dB; (b) signal-noise ratio is 4 dB; (c) signal-noise ratio is 6 dB; (d) signal-noise ratio is 8 dB
| ||||||||||||||||||||||||||||||||||||||||||||||
Table 1. Distributed optical fiber vibration signal event dataset
|
Table 2. Test results comparison of the three models in enhanced dataset

Set citation alerts for the article
Please enter your email address
© Copyright 2018-2021 | Chinese Laser Press. All Rights Reserved 沪ICP备15018463号-20