


Xiao Liang, Xinglong Xie, Jun Kang, Qingwei Yang, Hui Wei, Meizhi Sun, Jianqiang Zhu. Design and experimental demonstration of a high conversion efficiency OPCPA pre-amplifier for petawatt laser facility[J]. High Power Laser Science and Engineering, 2018, 6(4): 04000e58
- High Power Laser Science and Engineering
- Vol. 6, Issue 4, 04000e58 (2018)
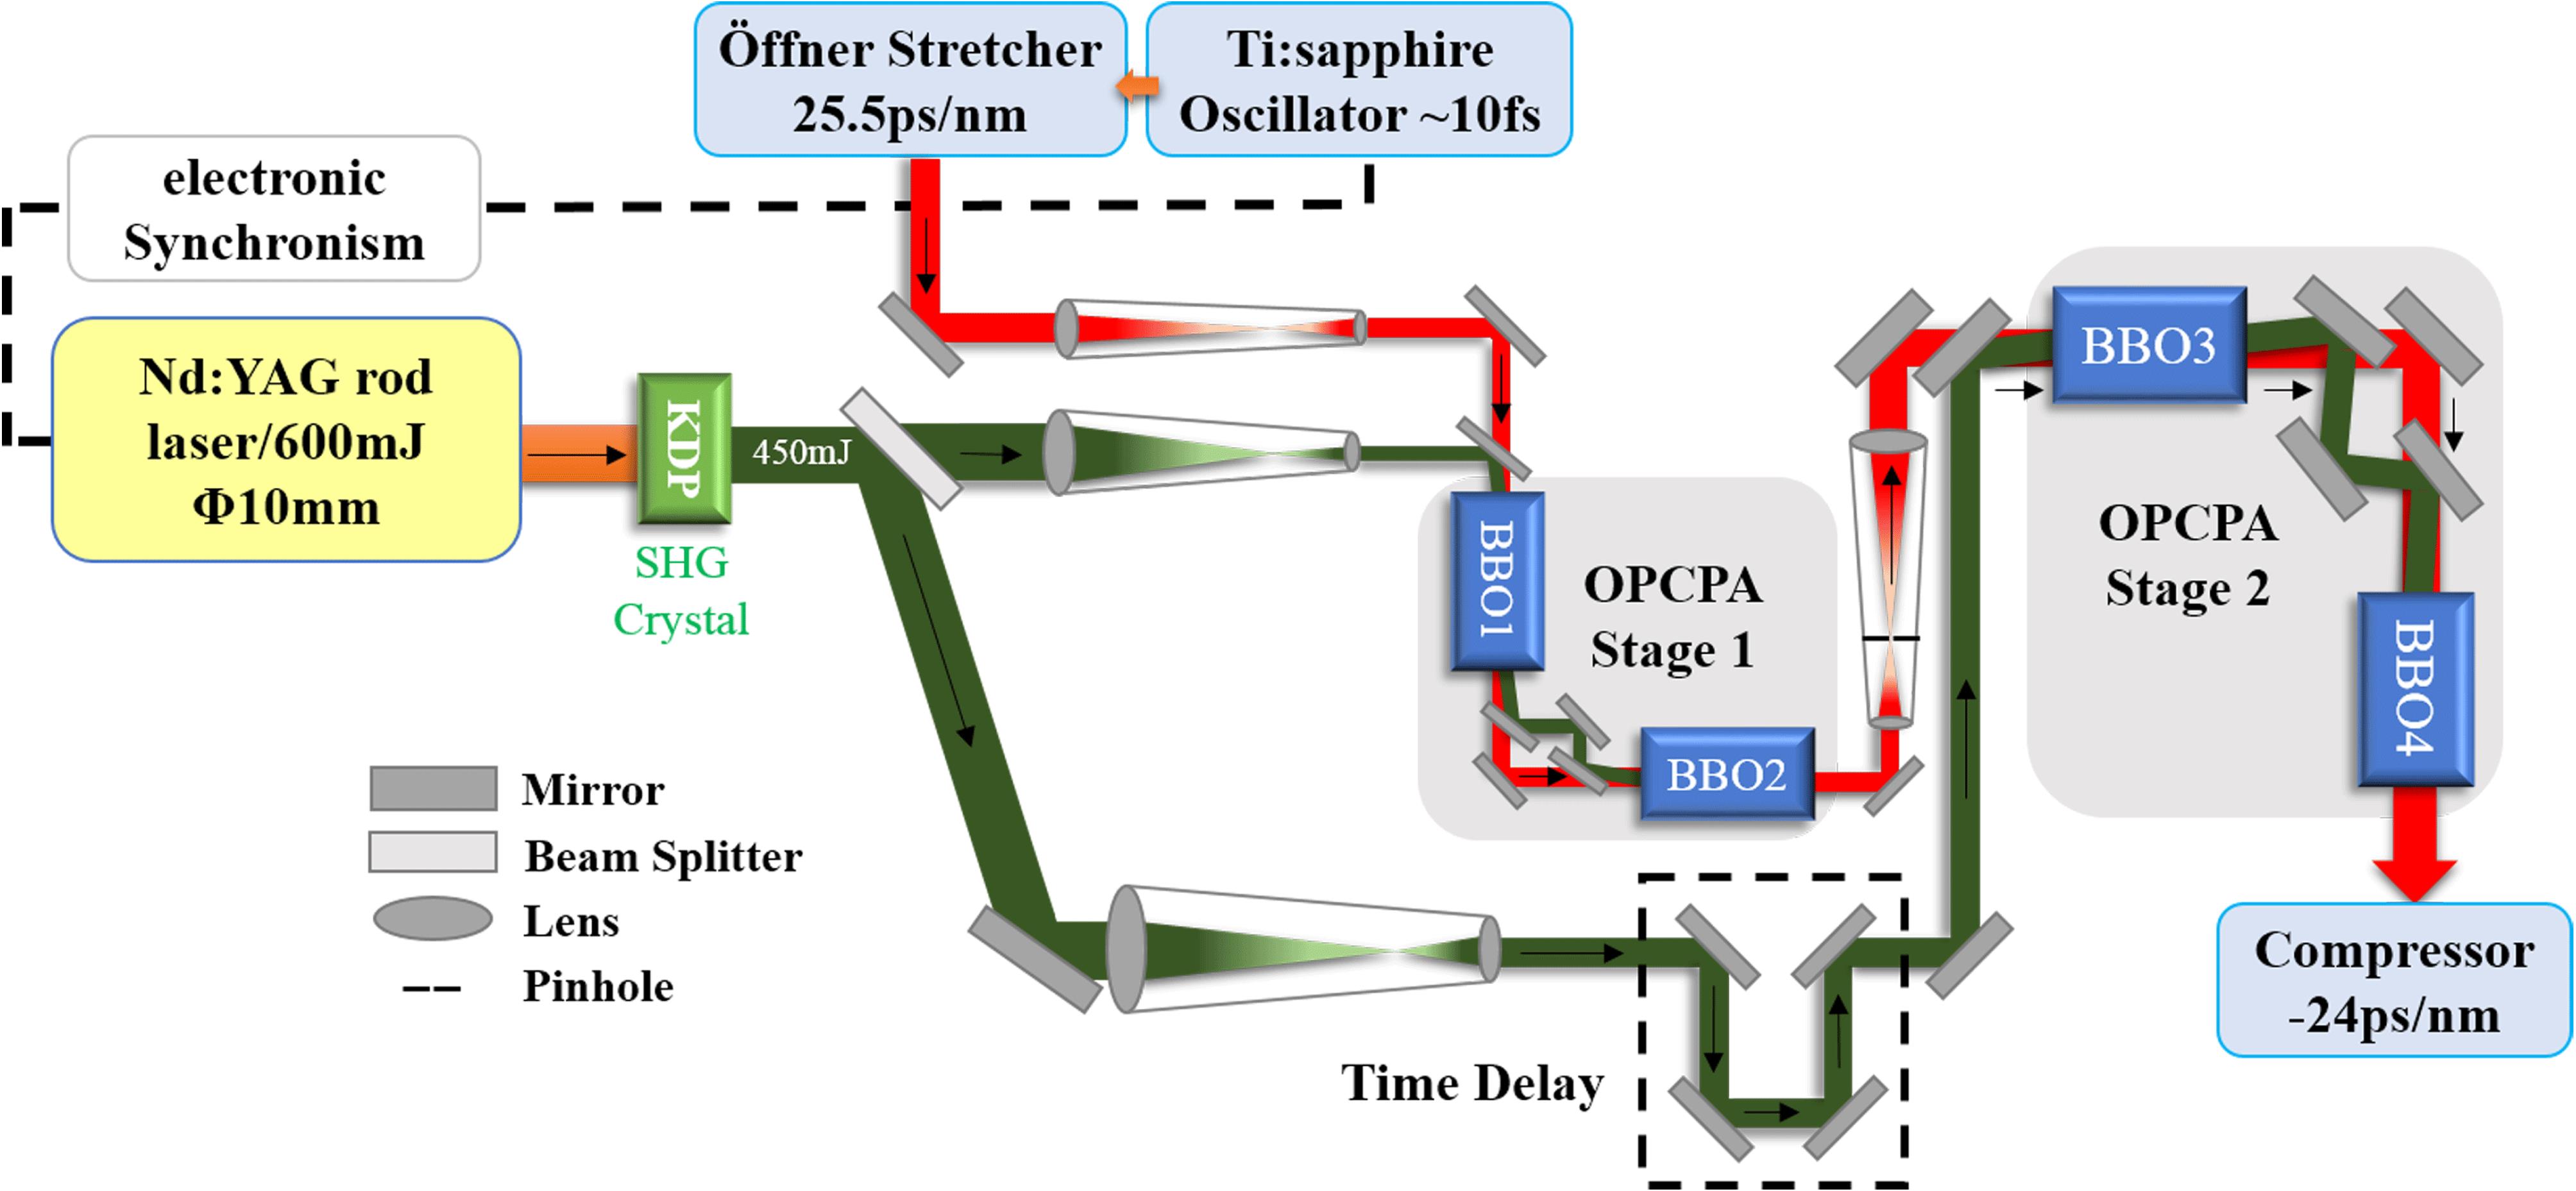
Fig. 1. OPCPA pre-amplifier schematic and laser path diagram.
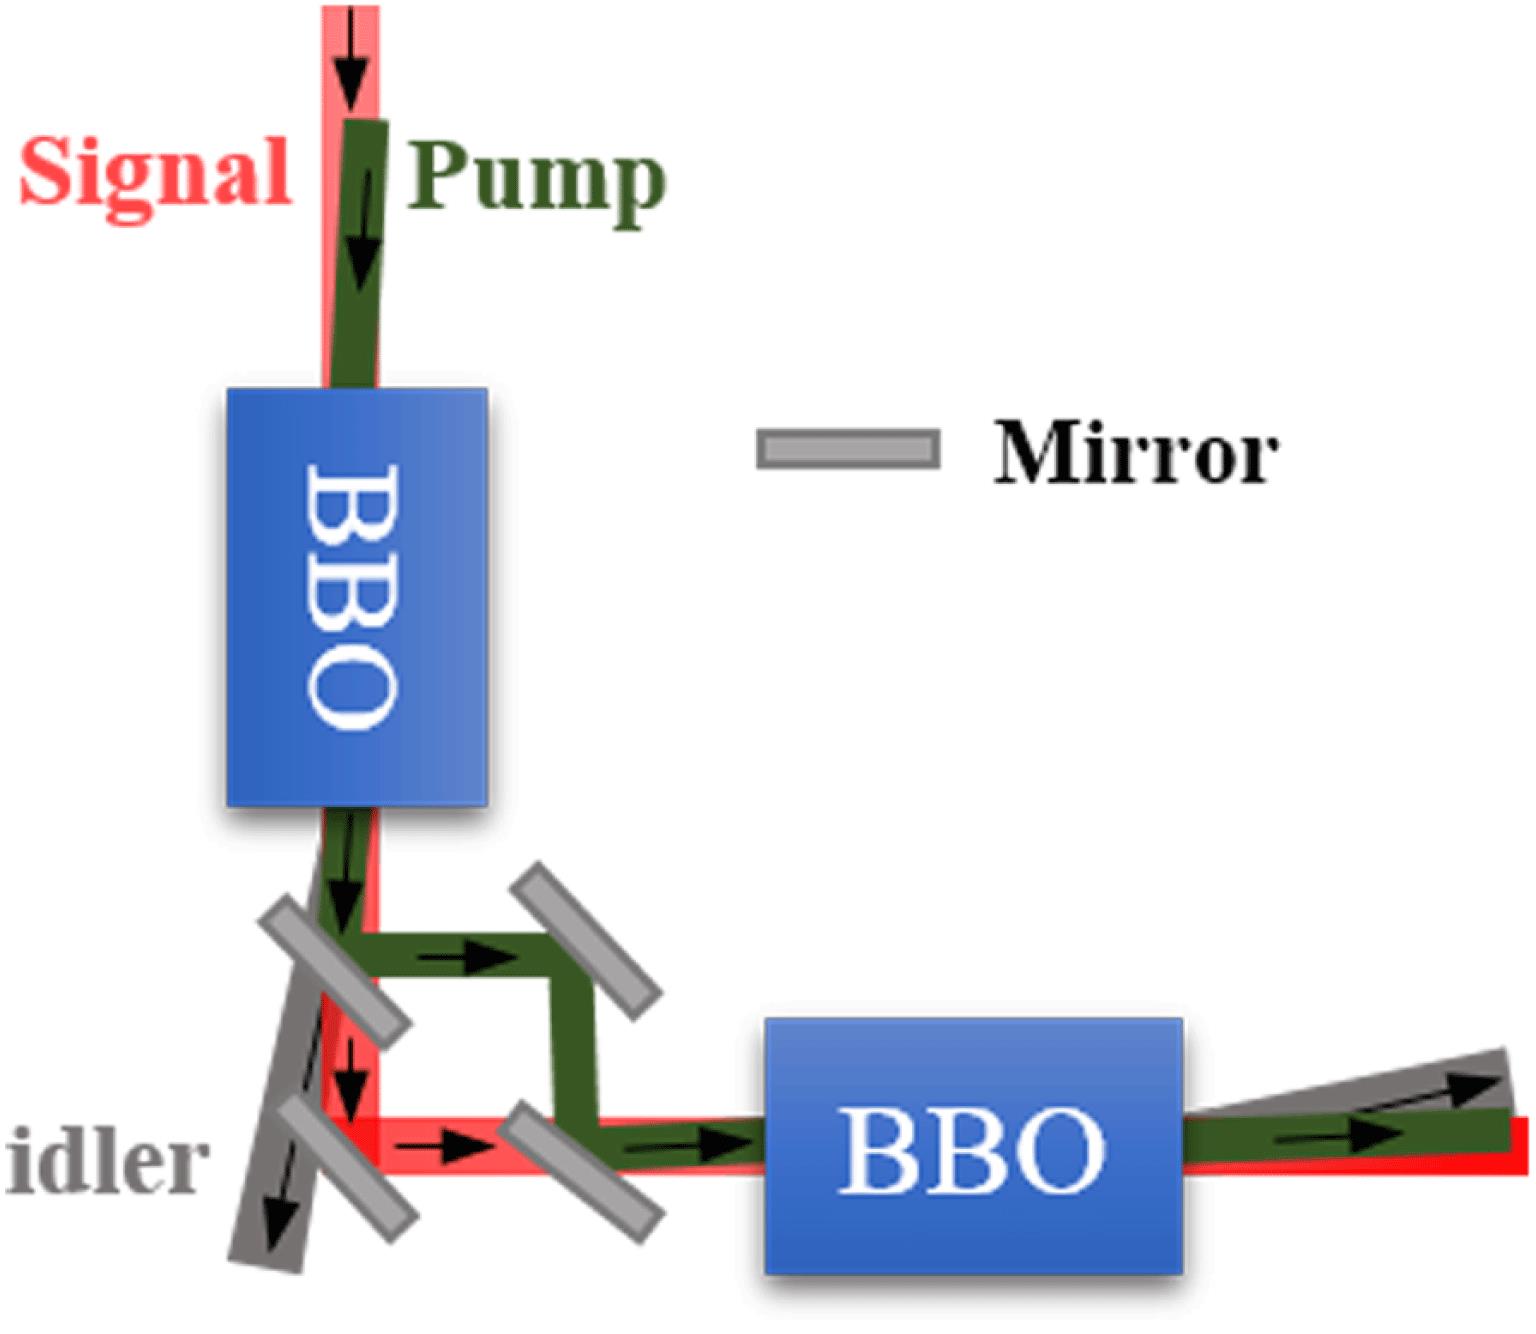
Fig. 2. Two BBO crystals OPCPA in ‘L’ type configuration.
Fig. 3. (a) Small signal gain bandwidth and (b) small signal gain versus various pump intensities. Different colors stand for different crystal lengths.
Fig. 4. Signal gain of OPCPA stage 1. Different colors stand for different crystal length combinations.
Fig. 5. OPCPA stage 1 output signal beam shape from: (a) one 46 mm long crystal; (b) two crystals in ‘L’ type configuration with
 length.
length. Fig. 6. (a) Conversion efficiency and (b) EBP of two BBO crystal combination in ‘L’ type configuration at OPCPA stage 2.
Fig. 7. OPA evolutionary process of signal at 808 nm and 765 nm wavelengths in stage 2. Crystals length combination in (a) and (b) is
 , while in (c) and (d) is
 . Red line represents signal, green line represents pump and blue line represents idler.
, while in (c) and (d) is
. Red line represents signal, green line represents pump and blue line represents idler. Fig. 8. Signal output energy versus length of two BBO crystals. The first crystal length is 15 mm. The pump energy variation is
 to the initial 450 mJ. A and B correspond to BBO4 crystal lengths of 11 mm and 7.5 mm.
to the initial 450 mJ. A and B correspond to BBO4 crystal lengths of 11 mm and 7.5 mm. Fig. 9. Signal output beam shape of OPCPA stage 2 for different lengths of BBO4 crystal. (a): 11 mm; (b) 7.5 mm; (c) 9 mm.
Fig. 10. Measured experimental output signal spectrum from different OPCPA stages. (a) Spectra from signal seed (cyan line) and BBO2 (green line); (b) spectra from BBO3 (blue line) and BBO4 (red line).
Fig. 11. Measurement of the output energy over 5 min.
Fig. 12. CCD measured output signal near-field at 161 mJ.
Fig. 13. Measured compressed pulse duration by an autocorrelator.
|
Table 1. Simulation output parameters of OPCPA stage 1.
|
Table 2. Simulation output parameters of OPCPA stage 2.
|
Table 3. Experimental output parameters.

Set citation alerts for the article
Please enter your email address
© Copyright 2018-2021 | Chinese Laser Press. All Rights Reserved 沪ICP备15018463号-20