• High Power Laser Science and Engineering
  • Vol. 4, Issue 3, 03000e33 (2016)
Bruno Gonzalez-Izquierdo1, Ross J. Gray1, Martin King1, Robbie Wilson1, Rachel J. Dance1, Haydn Powell1, David A. MacLellan1, John McCreadie1, Nicholas M. H. Butler1, Steve Hawkes1、2, James S. Green2, Chris D. Murphy3, Luca C. Stockhausen4, David C. Carroll2, Nicola Booth5, Graeme G. Scott1、2, Marco Borghesi2, David Neely1、2, and Paul McKenna1
Author Affiliations
  • 1SUPA Department of Physics, University of Strathclyde, Glasgow G4 0NG, UK
  • 2Central Laser Facility, STFC Rutherford Appleton Laboratory, Oxfordshire OX11 0QX, UK
  • 3Department of Physics, University of York, Heslington, York YO10 5DD, UK
  • 4Centro de L′aseres Pulsados (CLPU), M5 Parque Cient′?fico, 37185 Salamanca, Spain
  • 5Centre for Plasma Physics, Queens University Belfast, Belfast BT7 1NN, UK
  • show less
    DOI: 10.1017/hpl.2016.35 Cite this Article Set citation alerts
    Bruno Gonzalez-Izquierdo, Ross J. Gray, Martin King, Robbie Wilson, Rachel J. Dance, Haydn Powell, David A. MacLellan, John McCreadie, Nicholas M. H. Butler, Steve Hawkes, James S. Green, Chris D. Murphy, Luca C. Stockhausen, David C. Carroll, Nicola Booth, Graeme G. Scott, Marco Borghesi, David Neely, Paul McKenna. Influence of laser polarization on collective electron dynamics in ultraintense laser–foil interactions[J]. High Power Laser Science and Engineering, 2016, 4(3): 03000e33 Copy Citation Text show less
    (a)–(d) Electron density and laser intensity from a 2D PIC simulation employing circularly polarized light, for target thickness: (a) $l=500~\text{nm}$; (b) $l=200~\text{nm}$; (c) $l=40~\text{nm}$; (d) $l=10~\text{nm}$. All figures are at the same time step, corresponding to the moment that the $l=10~\text{nm}$ target becomes relativistically transparent.
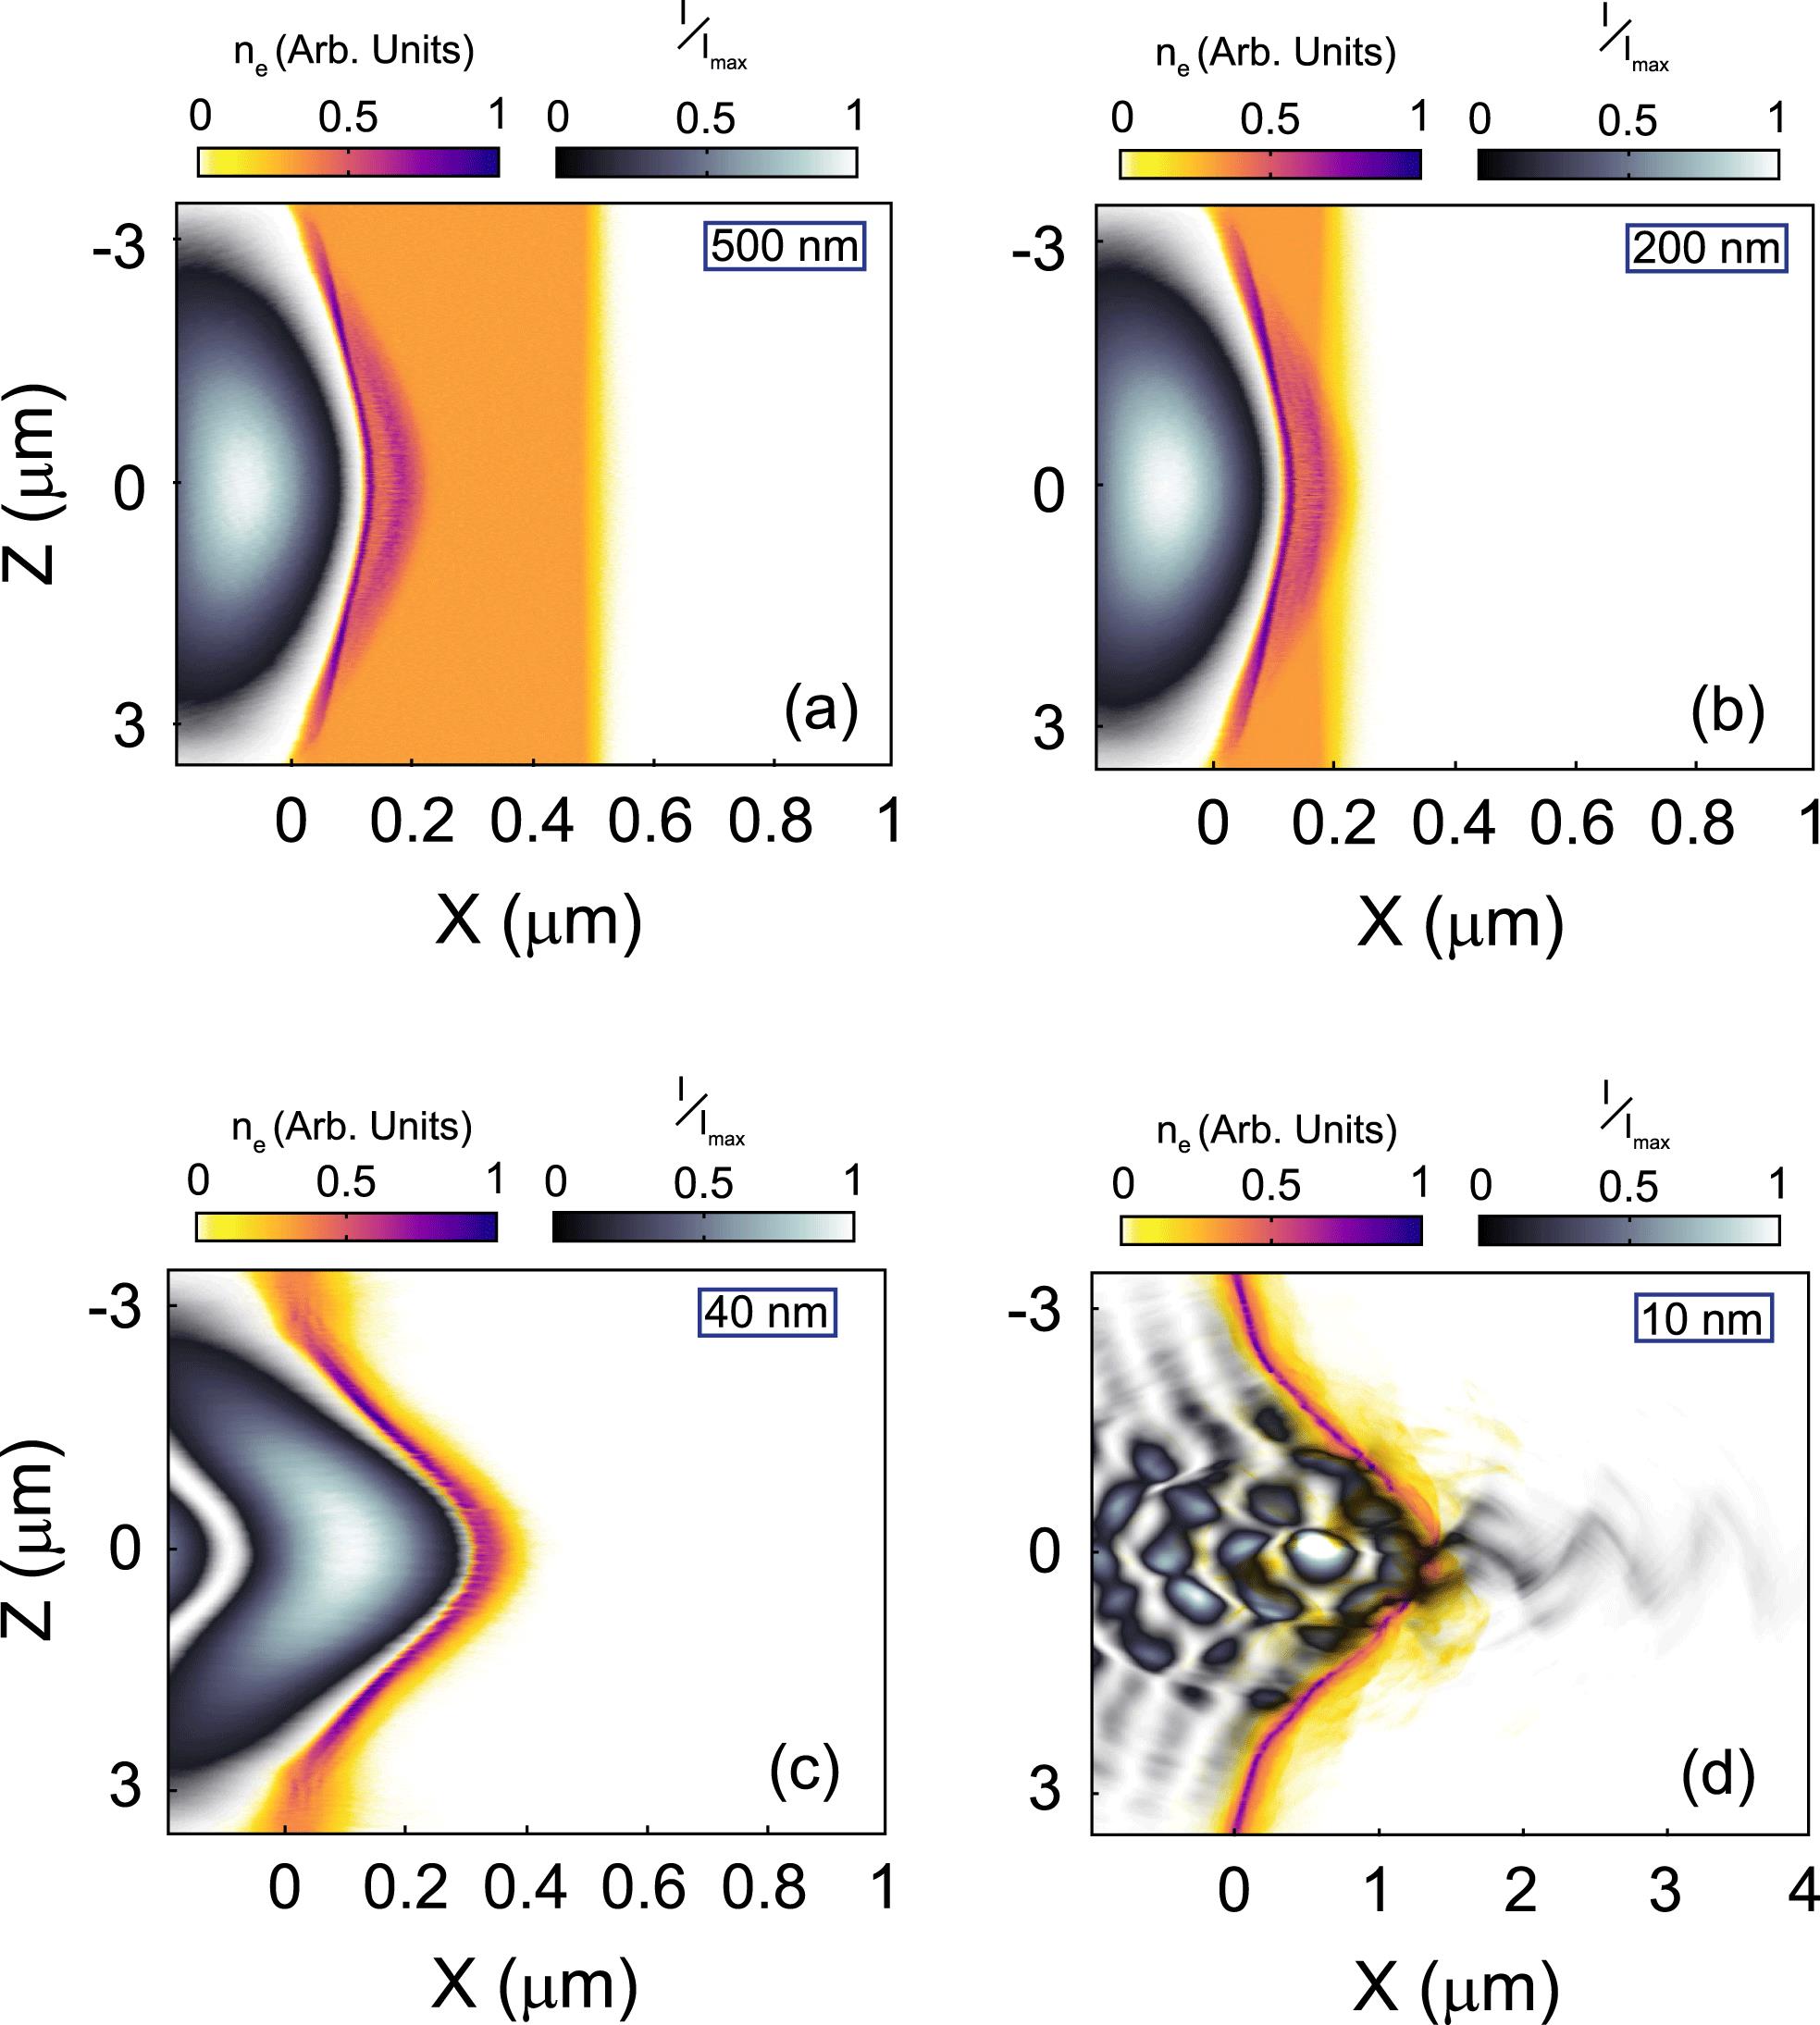
    Fig. 1. (a)–(d) Electron density and laser intensity from a 2D PIC simulation employing circularly polarized light, for target thickness: (a) $l=500~\text{nm}$; (b) $l=200~\text{nm}$; (c) $l=40~\text{nm}$; (d) $l=10~\text{nm}$. All figures are at the same time step, corresponding to the moment that the $l=10~\text{nm}$ target becomes relativistically transparent.
    (a) Layout of the laser beam path in the target chamber. The laser intensity contrast is increased using a double plasma mirror. Wave plates are inserted before focusing to vary the laser polarization. (b) Schematic showing the position of the IP stack detector used to measure the electron spatial-intensity distribution.
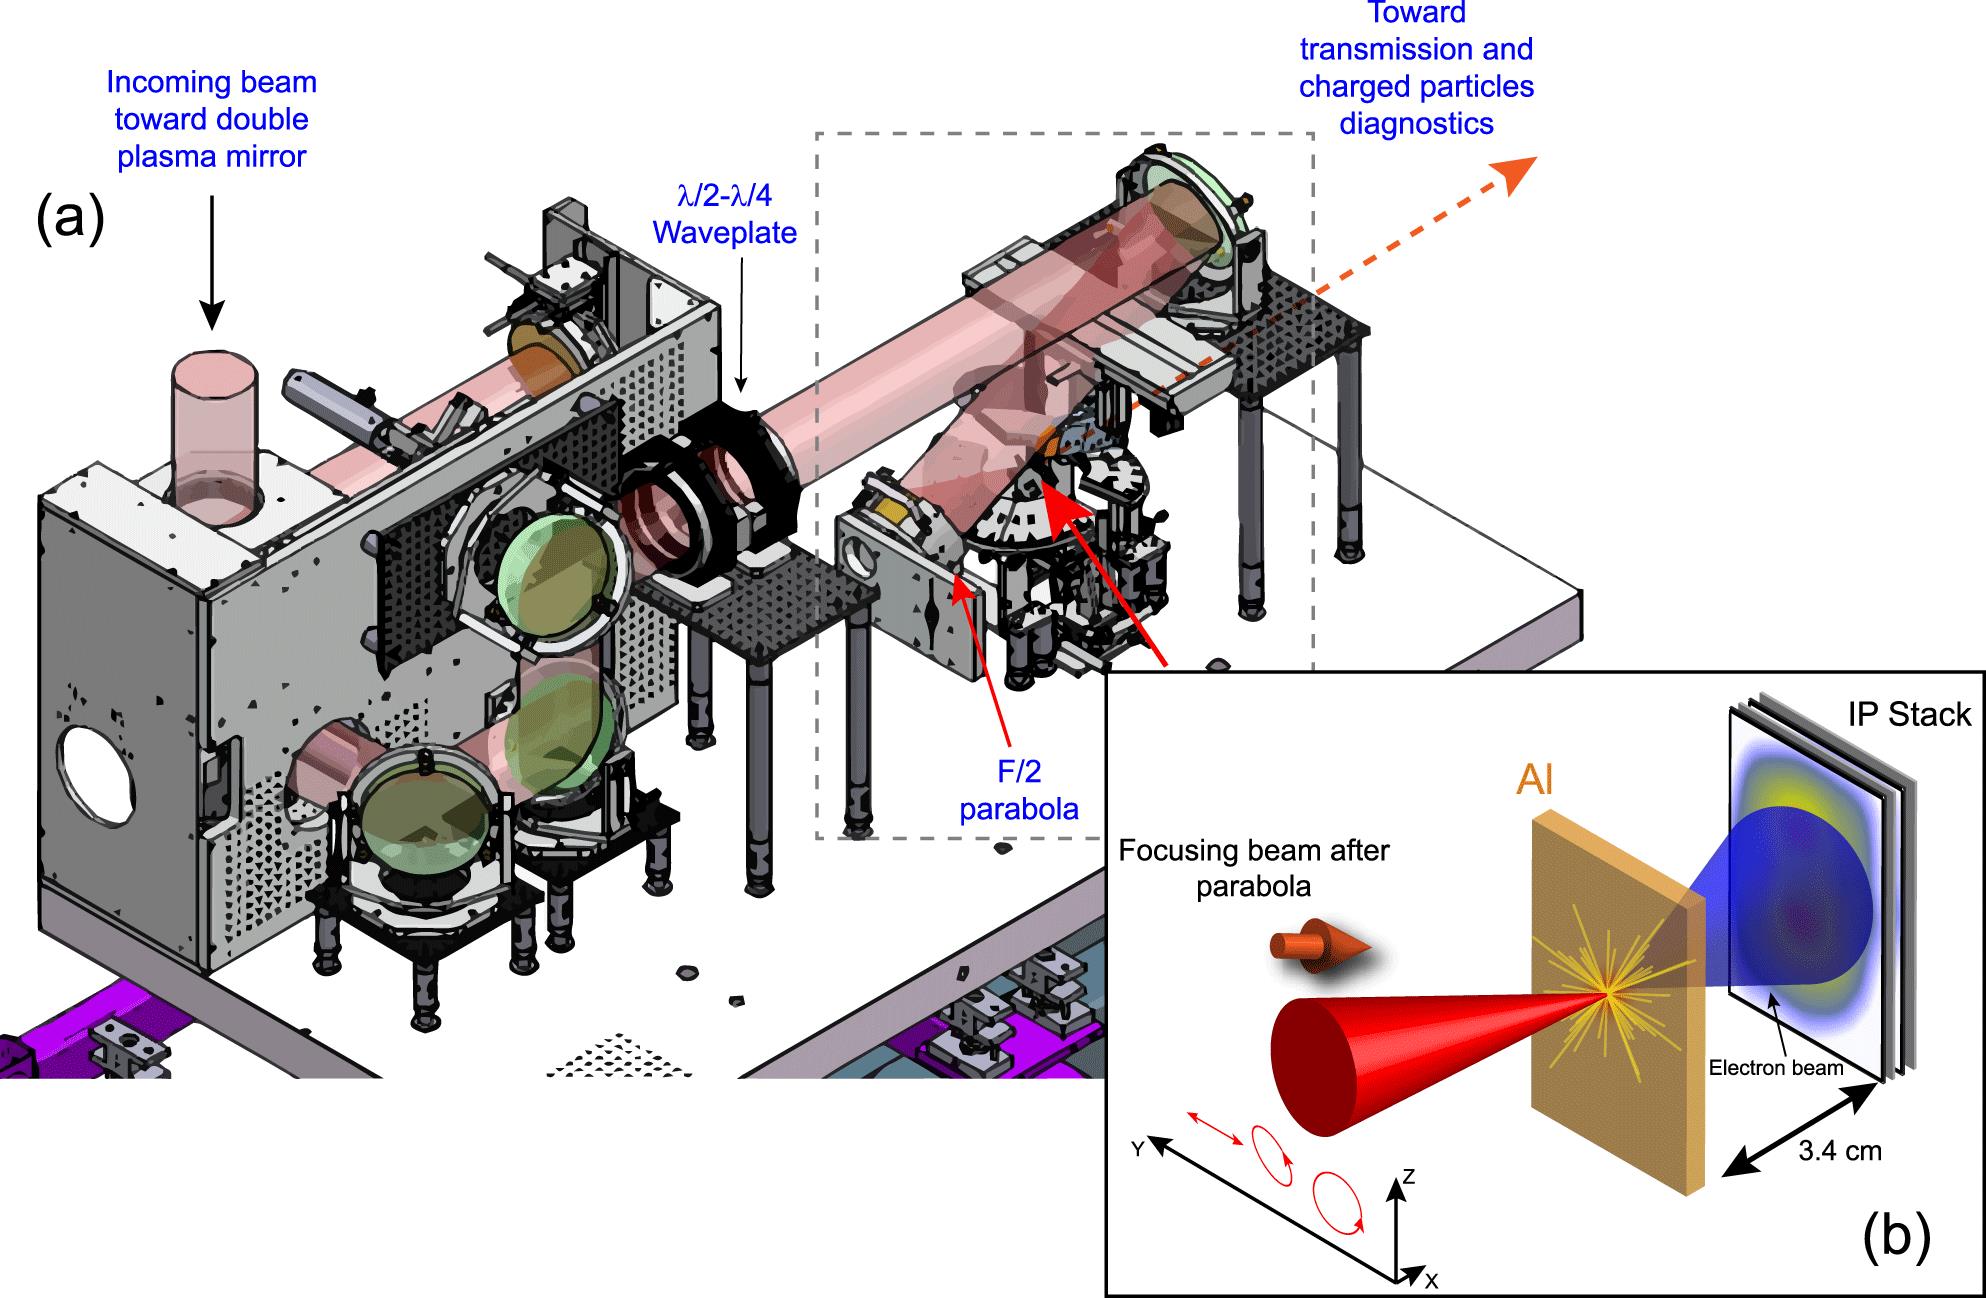
    Fig. 2. (a) Layout of the laser beam path in the target chamber. The laser intensity contrast is increased using a double plasma mirror. Wave plates are inserted before focusing to vary the laser polarization. (b) Schematic showing the position of the IP stack detector used to measure the electron spatial-intensity distribution.
    Measured electron density distribution. (a–d) Electron density as measured using IP for $l=800~\text{nm}$, for electrons with energy greater than: (a) 3.5 MeV; (b) 5.8 MeV; (c) 10.3 MeV; and (d) 17.0 MeV; all for linear polarization in the $Y$-axis. (e–h) Same for $l=40~\text{nm}$ and linear polarization in the $Y$-axis. (i–l) Same for $l=40~\text{nm}$ and linear polarization in the $Z$-axis. The colour maps are scaled by the stated value $F$ to clearly show the features of interest at each energy slice. The red arrows show the laser polarization.
    Fig. 3. Measured electron density distribution. (a–d) Electron density as measured using IP for $l=800~\text{nm}$, for electrons with energy greater than: (a) 3.5 MeV; (b) 5.8 MeV; (c) 10.3 MeV; and (d) 17.0 MeV; all for linear polarization in the $Y$-axis. (e–h) Same for $l=40~\text{nm}$ and linear polarization in the $Y$-axis. (i–l) Same for $l=40~\text{nm}$ and linear polarization in the $Z$-axis. The colour maps are scaled by the stated value $F$ to clearly show the features of interest at each energy slice. The red arrows show the laser polarization.
    Measured electron density distribution. (a–d) Electron density as measured using IP for $l=40~\text{nm}$, for electrons with energy greater than: (a) 3.5 MeV; (b) 5.8 MeV; (c) 10.3 MeV; and (d) 17.0 MeV; all for elliptical polarization ($\unicode[STIX]{x1D6E5}\unicode[STIX]{x1D703}=\unicode[STIX]{x1D70B}/4$). (e–h) Same for elliptical polarization ($\unicode[STIX]{x1D6E5}\unicode[STIX]{x1D703}=-\unicode[STIX]{x1D70B}/4$). (i–l) Same for circular polarization ($\unicode[STIX]{x1D6E5}\unicode[STIX]{x1D703}=\unicode[STIX]{x1D70B}/2$). The colour maps are scaled by the stated value $F$ to clearly show the features of interest at each energy slice. The red arrows show the laser polarization.
    Fig. 4. Measured electron density distribution. (a–d) Electron density as measured using IP for $l=40~\text{nm}$, for electrons with energy greater than: (a) 3.5 MeV; (b) 5.8 MeV; (c) 10.3 MeV; and (d) 17.0 MeV; all for elliptical polarization ($\unicode[STIX]{x1D6E5}\unicode[STIX]{x1D703}=\unicode[STIX]{x1D70B}/4$). (e–h) Same for elliptical polarization ($\unicode[STIX]{x1D6E5}\unicode[STIX]{x1D703}=-\unicode[STIX]{x1D70B}/4$). (i–l) Same for circular polarization ($\unicode[STIX]{x1D6E5}\unicode[STIX]{x1D703}=\unicode[STIX]{x1D70B}/2$). The colour maps are scaled by the stated value $F$ to clearly show the features of interest at each energy slice. The red arrows show the laser polarization.
    (a) Electron density for a $l=10~\text{nm}$ target as measured using IP for electrons with energy greater than 3.5 MeV for linear polarization. (b) Same for elliptical polarization. (c) Same for circular polarization. (d) Same as (a) but for a $l=40~\text{nm}$ target with energy greater than 10.3 MeV. (e)–(g) 3D PIC simulation results for the electron density distribution from $l=10~\text{nm}$ and energies $2 MeV for linear, elliptical and circular polarization, respectively. (h) Same but from $l=40~\text{nm}$ and energies $10 MeV and linearly polarized light. The red arrows show the laser polarization.
    Fig. 5. (a) Electron density for a $l=10~\text{nm}$ target as measured using IP for electrons with energy greater than 3.5 MeV for linear polarization. (b) Same for elliptical polarization. (c) Same for circular polarization. (d) Same as (a) but for a $l=40~\text{nm}$ target with energy greater than 10.3 MeV. (e)–(g) 3D PIC simulation results for the electron density distribution from $l=10~\text{nm}$ and energies $2 MeV for linear, elliptical and circular polarization, respectively. (h) Same but from $l=40~\text{nm}$ and energies $10 MeV and linearly polarized light. The red arrows show the laser polarization.
    (a) 2D ($X$–$Z$) slice in the $Y=0$ plane showing the electron density of a 10 nm target thickness overlaid with the laser intensity contour at three example time steps and linearly polarized light ($T=0$ corresponds to the time at which the laser peak interacts with the plasma). (b) Same for elliptical polarization showing the results in a 2D ($X$–$Z$) slice rotated $45^{\circ }$ around the laser propagation axis. (c) Same as (b) for circular polarization. (d–f) 2D ($Y$–$Z$) plane showing laser light intensity and electron density integrated over $X=0.7{-}1.5~\unicode[STIX]{x03BC}\text{m}$ (corresponding to one laser wavelength in the region of the high density of electrons that are accelerated forward) for linear, elliptical and circular polarization, respectively and 10 nm target thickness. The hollow arrows illustrate the direction of the ponderomotive force arising from the gradients in laser intensity.
    Fig. 6. (a) 2D ($X$$Z$) slice in the $Y=0$ plane showing the electron density of a 10 nm target thickness overlaid with the laser intensity contour at three example time steps and linearly polarized light ($T=0$ corresponds to the time at which the laser peak interacts with the plasma). (b) Same for elliptical polarization showing the results in a 2D ($X$$Z$) slice rotated $45^{\circ }$ around the laser propagation axis. (c) Same as (b) for circular polarization. (d–f) 2D ($Y$$Z$) plane showing laser light intensity and electron density integrated over $X=0.7{-}1.5~\unicode[STIX]{x03BC}\text{m}$ (corresponding to one laser wavelength in the region of the high density of electrons that are accelerated forward) for linear, elliptical and circular polarization, respectively and 10 nm target thickness. The hollow arrows illustrate the direction of the ponderomotive force arising from the gradients in laser intensity.
    Bruno Gonzalez-Izquierdo, Ross J. Gray, Martin King, Robbie Wilson, Rachel J. Dance, Haydn Powell, David A. MacLellan, John McCreadie, Nicholas M. H. Butler, Steve Hawkes, James S. Green, Chris D. Murphy, Luca C. Stockhausen, David C. Carroll, Nicola Booth, Graeme G. Scott, Marco Borghesi, David Neely, Paul McKenna. Influence of laser polarization on collective electron dynamics in ultraintense laser–foil interactions[J]. High Power Laser Science and Engineering, 2016, 4(3): 03000e33
    Download Citation