• Journal of Geo-information Science
  • Vol. 22, Issue 2, 268 (2020)
Pengpeng LI, Yongqiang LI*, Lailiang CAI, Yahan DONG, and Huilong FAN
Author Affiliations
  • School of Surveying and Land Information Engineering, Henan Polytechnic University, Jiaozuo 454003, China
  • show less
    DOI: 10.12082/dqxxkx.2020.190196 Cite this Article
    Pengpeng LI, Yongqiang LI, Lailiang CAI, Yahan DONG, Huilong FAN. Road Green Belt Extraction and Dynamic Analysis based on Vehicle LiDAR Points Cloud[J]. Journal of Geo-information Science, 2020, 22(2): 268 Copy Citation Text show less
    Flowchart of green belt extraction and objects classification
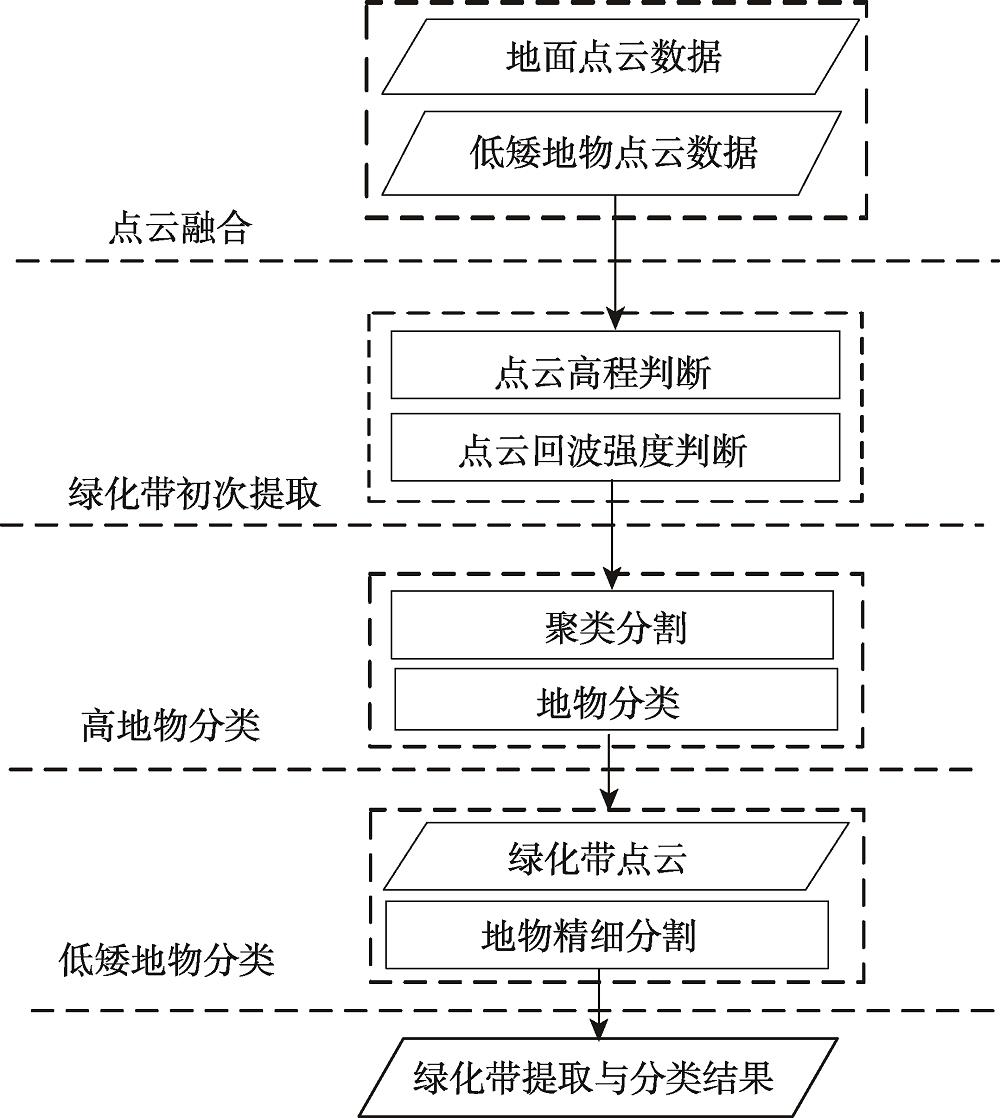
    Fig. 1. Flowchart of green belt extraction and objects classification
    Improved mathematical morphological filtering algorithms
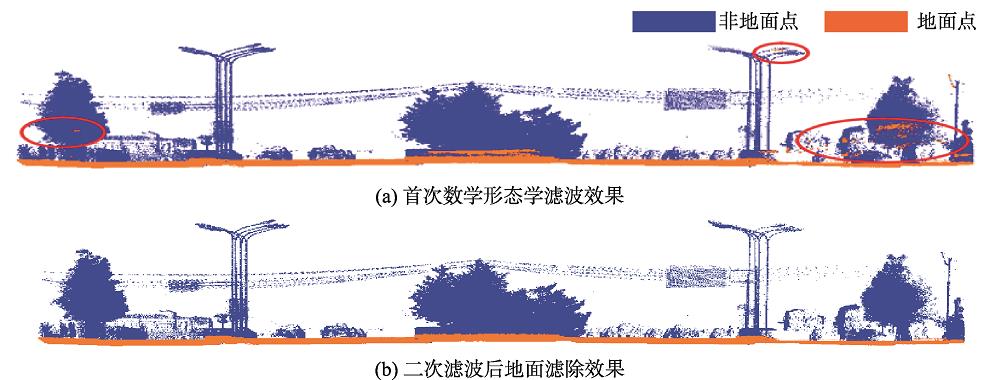
    Fig. 2. Improved mathematical morphological filtering algorithms
    Ground points and low ground objects extraction results
    Fig. 3. Ground points and low ground objects extraction results
    Elevation extraction and echo strength histogram
    Fig. 4. Elevation extraction and echo strength histogram
    Points cloud clustering and green belt extraction result
    Fig. 5. Points cloud clustering and green belt extraction result
    Typical low ground objects' points clouds
    Fig. 6. Typical low ground objects' points clouds
    Classification of low ground objects in the green belt
    Fig. 7. Classification of low ground objects in the green belt
    Raw points cloud data of the experiment area
    Fig. 8. Raw points cloud data of the experiment area
    Overall and partial extraction results of green belts
    Fig. 9. Overall and partial extraction results of green belts
    Overall and partial classification results of green belts
    Fig. 10. Overall and partial classification results of green belts
    Map of local landform change in the green belts
    Fig. 11. Map of local landform change in the green belts
    地物地物点云上部投影示意下部投影示意
    行道树
    电线杆
    路灯
    Table 1. Top and bottom projections of three typical features
    地块编号S1/m2S2/m2S1-S2相对误差
    1811829-18-0.02
    217921883-91-0.05
    313501392-42-0.03
    414011408-7-0.00
    513781418-40-0.03
    613351298370.03
    714221437-15-0.01
    812081221-13-0.01
    915261588-62-0.04
    10526553-27-0.05
    总和12 74913 027-278-0.02
    Table 2. Comparing the results of calculating greenbelt area by the two methods
    杆状地物树木灌木
    人工判读/个856646
    算法提取/个715444
    正确提取数/个715434
    差值/个141210
    提取正确率/%10010077.27
    提取率/%83.5281.8173.91
    Table 3. Comparison of the numbers of various feature types
    绿化带A(X1, Y1)B(X2, Y2)C(X3, Y4)D(X4, Y4)面积/m2
    一期数据(1.6, -98.8)(1.6, -107.9)(1130.7, -106.7)(130.8, -98.8)879.3
    二期数据(1.6, -98.9)(1.6, -107.5)(110.9, -106.8)(110.6, -98.6)749.8
    Table 4. Comparison of overall information of the green belts
    面积/m2体积/m3冠幅/m
    一期二期一期二期一期二期
    草地762.3509.2
    灌木141.2032.003.303.14
    灌木245.5039.703.543.68
    灌木331.8026.703.523.53
    灌木440.6547.703.824.26
    Table 5. Comparison of physical information in the green belts
    Pengpeng LI, Yongqiang LI, Lailiang CAI, Yahan DONG, Huilong FAN. Road Green Belt Extraction and Dynamic Analysis based on Vehicle LiDAR Points Cloud[J]. Journal of Geo-information Science, 2020, 22(2): 268
    Download Citation